General Motors 2011 Annual Report Download - page 175
Download and view the complete annual report
Please find page 175 of the 2011 General Motors annual report below. You can navigate through the pages in the report by either clicking on the pages listed below, or by using the keyword search tool below to find specific information within the annual report.-
 1
1 -
2
-
3
-
4
-
5
-
6
-
7
-
8
-
9
-
10
-
11
-
12
-
13
-
14
-
15
-
16
-
17
-
18
-
19
-
20
-
21
-
22
-
23
-
24
-
25
-
26
-
27
-
28
-
29
-
30
-
31
-
32
-
33
-
34
-
35
-
36
-
37
-
38
-
39
-
40
-
41
-
42
-
43
-
44
-
45
-
46
-
47
-
48
-
49
-
50
-
51
-
52
-
53
-
54
-
55
-
56
-
57
-
58
-
59
-
60
-
61
-
62
-
63
-
64
-
65
-
66
-
67
-
68
-
69
-
70
-
71
-
72
-
73
-
74
-
75
-
76
-
77
-
78
-
79
-
80
-
81
-
82
-
83
-
84
-
85
-
86
-
87
-
88
-
89
-
90
-
91
-
92
-
93
-
94
-
95
-
96
-
97
-
98
-
99
-
100
-
101
-
102
-
103
-
104
-
105
-
106
-
107
-
108
-
109
-
110
-
111
-
112
-
113
-
114
-
115
-
116
-
117
-
118
-
119
-
120
-
121
-
122
-
123
-
124
-
125
-
126
-
127
-
128
-
129
-
130
-
131
-
132
-
133
-
134
-
135
-
136
-
137
-
138
-
139
-
140
-
141
-
142
-
143
-
144
-
145
-
146
-
147
-
148
-
149
-
150
-
151
-
152
-
153
-
154
-
155
-
156
-
157
-
158
-
159
-
160
-
161
-
162
-
163
-
164
-
 165
165 -
 166
166 -
 167
167 -
 168
168 -
 169
169 -
 170
170 -
 171
171 -
 172
172 -
 173
173 -
 174
174 -
 175
175 -
 176
176 -
 177
177 -
 178
178 -
 179
179 -
 180
180 -
 181
181 -
 182
182 -
 183
183 -
 184
184 -
 185
185 -
186
-
187
-
188
-
189
-
190
-
191
-
192
-
193
-
194
-
195
-
196
-
197
-
198
-
199
-
200
 |
 |

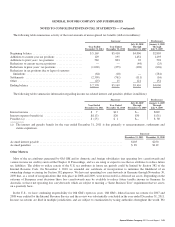
GENERAL MOTORS COMPANY AND SUBSIDIARIES
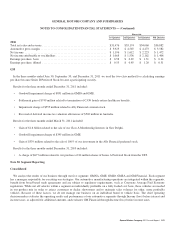
NOTES TO CONSOLIDATED FINANCIAL STATEMENTS — (Continued)
Successor Predecessor
July 10, 2009
Through
December 31, 2009
January 1, 2009
Through
July 9, 2009
Pre-tax
Amount
Tax
Expense
(Benefit)
Net
Amount
Pre-tax
Amount
Tax
Expense
(Benefit)
Net
Amount
Foreign currency translation gain . . . . . . . . . . . . . . . . . . . . . . . . . . . . . . . $ 135 $ 11 $ 124 $ 187 $ 40 $ 147
Cash flow hedging gains (losses), net . . . . . . . . . . . . . . . . . . . . . . . . . . . . (1) — (1) 145 (131) 276
Unrealizedgainonsecurities................................... 7 5 2 46 — 46
Defined benefit plans
Prior service benefit (cost) from plan amendments . . . . . . . . . . . . . . . . 112 130 (18) (3,882) (1,551) (2,331)
Less: amortization of prior service cost included in net periodic
benefit cost ............................................. — — — 5,162 3 5,159
Net prior service benefit (cost) . . . . . . . . . . . . . . . . . . . . . . . . . . . . . . . 112 130 (18) 1,280 (1,548) 2,828
Actuarial loss from plan measurements ........................ 2,702 1,247 1,455 (2,574) 1,532 (4,106)
Less: amortization of actuarial loss included in net periodic benefit
cost................................................... (6) 1 (7) (2,109) 22 (2,131)
Net actuarial amounts ...................................... 2,696 1,248 1,448 (4,683) 1,554 (6,237)
Net transition assets from plan initiations ....................... — — — 6 1 5
Less: amortization of transition asset/obligation included in net
periodicbenefitcost ..................................... — — — (5) (1) (4)
Net transition amounts ...................................... — — — 1 — 1
Defined benefit plans, net ................................... 2,808 1,378 1,430 (3,402) 6 (3,408)
Other comprehensive income (loss) ............................. 2,949 1,394 1,555 (3,024) (85) (2,939)
Less: other comprehensive income (loss) attributable to
noncontrolling interests ................................... (33) — (33) 92 — 92
Other comprehensive income (loss) attributable to common
stockholders .............................................. $2,982 $1,394 $1,588 $(3,116) $ (85) $(3,031)
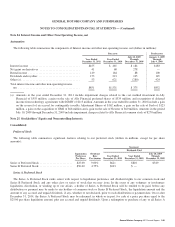
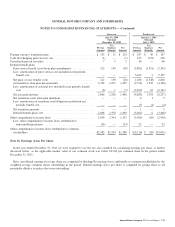
Note 26. Earnings (Loss) Per Share
In the year ended December 31, 2011 we were required to use the two-class method for calculating earnings per share, as further
discussed below, as the applicable market value of our common stock was below $33.00 per common share in the period ended
December 31, 2011.
Basic and diluted earnings (loss) per share are computed by dividing Net income (loss) attributable to common stockholders by the
weighted-average common shares outstanding in the period. Diluted earnings (loss) per share is computed by giving effect to all
potentially dilutive securities that were outstanding.
General Motors Company 2011 Annual Report 173