General Motors 2011 Annual Report Download - page 42
Download and view the complete annual report
Please find page 42 of the 2011 General Motors annual report below. You can navigate through the pages in the report by either clicking on the pages listed below, or by using the keyword search tool below to find specific information within the annual report.-
 1
1 -
2
-
3
-
4
-
5
-
6
-
7
-
8
-
9
-
10
-
11
-
12
-
13
-
14
-
15
-
16
-
17
-
18
-
19
-
20
-
21
-
22
-
23
-
24
-
25
-
26
-
27
-
28
-
29
-
30
-
31
-
 32
32 -
 33
33 -
 34
34 -
 35
35 -
 36
36 -
 37
37 -
 38
38 -
 39
39 -
 40
40 -
 41
41 -
 42
42 -
 43
43 -
 44
44 -
 45
45 -
 46
46 -
 47
47 -
 48
48 -
 49
49 -
 50
50 -
 51
51 -
 52
52 -
53
-
54
-
55
-
56
-
57
-
58
-
59
-
60
-
61
-
62
-
63
-
64
-
65
-
66
-
67
-
68
-
69
-
70
-
71
-
72
-
73
-
74
-
75
-
76
-
77
-
78
-
79
-
80
-
81
-
82
-
83
-
84
-
85
-
86
-
87
-
88
-
89
-
90
-
91
-
92
-
93
-
94
-
95
-
96
-
97
-
98
-
99
-
100
-
101
-
102
-
103
-
104
-
105
-
106
-
107
-
108
-
109
-
110
-
111
-
112
-
113
-
114
-
115
-
116
-
117
-
118
-
119
-
120
-
121
-
122
-
123
-
124
-
125
-
126
-
127
-
128
-
129
-
130
-
131
-
132
-
133
-
134
-
135
-
136
-
137
-
138
-
139
-
140
-
141
-
142
-
143
-
144
-
145
-
146
-
147
-
148
-
149
-
150
-
151
-
152
-
153
-
154
-
155
-
156
-
157
-
158
-
159
-
160
-
161
-
162
-
163
-
164
-
165
-
166
-
167
-
168
-
169
-
170
-
171
-
172
-
173
-
174
-
175
-
176
-
177
-
178
-
179
-
180
-
181
-
182
-
183
-
184
-
185
-
186
-
187
-
188
-
189
-
190
-
191
-
192
-
193
-
194
-
195
-
196
-
197
-
198
-
199
-
200
 |
 |

GENERAL MOTORS COMPANY AND SUBSIDIARIES
Corporate
(Dollars in Millions)
Successor
Combined GM
and Old GM Successor Predecessor
Year Ended
December 31,
2011
Year Ended
December 31,
2010
Year Ended
December 31,
2009
July 10, 2009
Through
December 31,
2009
January 1,
2009
Through
July 9, 2009
Year Ended
2011 vs. 2010
Change
Year Ended
2010 vs. 2009
Change
Amount % Amount %
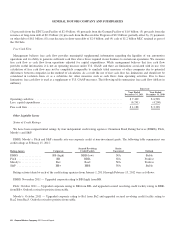
Total net sales and
revenue . . . . . . . . . . . . . . $ 61 $ 134 $468 $141 $ 327 $ (73) (54.5)% $(334) (71.4)%
Net income (loss)
attributable to
stockholders .......... $(453) $(877) $176 $123,902 $424 (48.3)%
Nonsegment operations are classified as Corporate. Corporate includes investments in Ally Financial, certain centrally recorded
income and costs, such as interest, income taxes and corporate expenditures, certain nonsegment specific revenues and expenses,
including costs related to the DBGA and a portfolio of automotive retail leases.
Corporate Total Net Sales and Revenue
Total net sales and revenue includes lease financing revenue from a portfolio of automotive retail leases.
In the year ended December 31, 2011 Total net sales and revenue decreased by $0.1 billion (or 54.5%) due primarily to decreased
revenue earned on portfolio management services performed for third parties due to the planned reduction of third party assets
managed and decreased lease financing revenues related to the liquidation of the portfolio of automotive retail leases. Average
outstanding retail leases on-hand decreased to a de minimus level at December 31, 2011 compared to 7,000 at December 31, 2010.
In the year ended December 31, 2010 Total net sales and revenue decreased by $0.3 billion (or 71.4%) due primarily to decreased
lease financing revenue related to the liquidation of the portfolio of automotive leases. Average outstanding automotive retail leases
on-hand for GM and combined GM and Old GM were 7,000 and 73,000 for the years ended December 31, 2010 and 2009.
Corporate Net Income (Loss) Attributable to Stockholders
GM
In the year ended December 31, 2011 Net loss attributable to stockholders decreased by $0.4 billion (or 48.3%) due primarily to:
(1) an income tax benefit of $0.3 billion compared to income tax expense of $0.6 billion in 2010; (2) decreased interest expense of
$0.6 billion due to lower debt balances; and (3) a gain of $0.3 billion related to the sale of our Ally Financial preferred stock; offset by
(4) an impairment charge of $0.6 billion on our investment in Ally Financial common stock; (5) gains on the extinguishment of debt
of $0.2 billion related to the repayment of the VEBA Notes and the elimination of the liability for the Adjustment Shares of $0.2
billion in 2010; and (6) other collectively insignificant items.
In the year ended December 31, 2010 results included: (1) interest expense of $1.1 billion; (2) income tax expense of $0.6 billion
related to tax expense attributable to profitable entities that do not have full valuation allowances recorded against deferred tax assets;
(3) administrative expenses of $0.4 billion related to consulting services; partially offset by (4) interest income of $0.4 billion earned
on marketable securities held in GMSA; (5) the reversal of our $0.2 billion liability for the Adjustment Shares; (6) a gain on
extinguishment of debt of $0.2 billion related to our repayment of the outstanding amount of VEBA Notes of $2.8 billion; and
(7) dividends of $0.1 billion on our investment in Ally Financial preferred stock.
In the period July 10, 2009 through December 31, 2009 results included: (1) foreign currency transaction gains of $0.3 billion due
to the strengthening of the Canadian Dollar against the U.S. Dollar; partially offset by (2) interest expense of $0.7 billion composed of
interest expense of $0.3 billion on UST Credit Agreement and interest expense of $0.2 billion on GMIO debt.
40 General Motors Company 2011 Annual Report