General Motors 2011 Annual Report Download - page 141
Download and view the complete annual report
Please find page 141 of the 2011 General Motors annual report below. You can navigate through the pages in the report by either clicking on the pages listed below, or by using the keyword search tool below to find specific information within the annual report.-
 1
1 -
2
-
3
-
4
-
5
-
6
-
7
-
8
-
9
-
10
-
11
-
12
-
13
-
14
-
15
-
16
-
17
-
18
-
19
-
20
-
21
-
22
-
23
-
24
-
25
-
26
-
27
-
28
-
29
-
30
-
31
-
32
-
33
-
34
-
35
-
36
-
37
-
38
-
39
-
40
-
41
-
42
-
43
-
44
-
45
-
46
-
47
-
48
-
49
-
50
-
51
-
52
-
53
-
54
-
55
-
56
-
57
-
58
-
59
-
60
-
61
-
62
-
63
-
64
-
65
-
66
-
67
-
68
-
69
-
70
-
71
-
72
-
73
-
74
-
75
-
76
-
77
-
78
-
79
-
80
-
81
-
82
-
83
-
84
-
85
-
86
-
87
-
88
-
89
-
90
-
91
-
92
-
93
-
94
-
95
-
96
-
97
-
98
-
99
-
100
-
101
-
102
-
103
-
104
-
105
-
106
-
107
-
108
-
109
-
110
-
111
-
112
-
113
-
114
-
115
-
116
-
117
-
118
-
119
-
120
-
121
-
122
-
123
-
124
-
125
-
126
-
127
-
128
-
129
-
130
-
 131
131 -
 132
132 -
 133
133 -
 134
134 -
 135
135 -
 136
136 -
 137
137 -
 138
138 -
 139
139 -
 140
140 -
 141
141 -
 142
142 -
 143
143 -
 144
144 -
 145
145 -
 146
146 -
 147
147 -
 148
148 -
 149
149 -
 150
150 -
 151
151 -
152
-
153
-
154
-
155
-
156
-
157
-
158
-
159
-
160
-
161
-
162
-
163
-
164
-
165
-
166
-
167
-
168
-
169
-
170
-
171
-
172
-
173
-
174
-
175
-
176
-
177
-
178
-
179
-
180
-
181
-
182
-
183
-
184
-
185
-
186
-
187
-
188
-
189
-
190
-
191
-
192
-
193
-
194
-
195
-
196
-
197
-
198
-
199
-
200
 |
 |

GENERAL MOTORS COMPANY AND SUBSIDIARIES
NOTES TO CONSOLIDATED FINANCIAL STATEMENTS — (Continued)
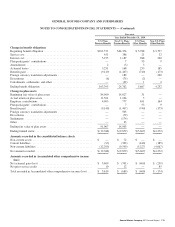
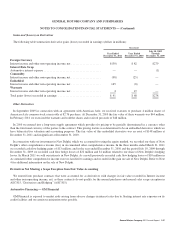
(b) Includes U.S. and sovereign government and agency issues; excludes mortgage and asset-backed securities.
(c) Includes bank debt obligations.
(d) Primarily investments in alternative investment funds.
(e) Includes private equity investment funds.
(f) Includes investment funds and public real estate investment trusts.
(g) Primarily investments sold short.
(h) Cash held by the plans, net of amounts payable for investment manager fees, custody fees and other expenses.
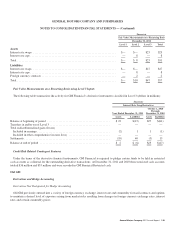
The following tables summarize the activity for U.S. plan assets classified in Level 3 (dollars in millions):
Balance at
January 1,
2011
Net
Realized/
Unrealized
Gains (Loss)
Purchases,
Sales and
Settlements,
Net
Transfers
Into/Out
of Level 3
Balance at
December 31,
2011
Change in
Unrealized
Gains/
(Losses)
Attributable
to Assets
Held at
December 31,
2011
Assets
Common and preferred stocks . . . . . . . . . . . . . . . . . . . . . $ 64 $ (4) $ (11) $ (3) $ 46 $ (53)
Government and agency debt securities . . . . . . . . . . . . . . 75 (9) (63) — 3 1
Corporate debt securities . . . . . . . . . . . . . . . . . . . . . . . . . . 562 (29) (168) (13) 352 (49)
Non-agency mortgage and asset-backed securities . . . . . . 821 (8) (625) 9 197 (57)
Group annuity contracts .......................... 3,115 302 (208) — 3,209 302
Investment funds
Equity funds . . . . . . . . . . . . . . . . . . . . . . . . . . . . . . . . . 382 (129) 268 — 521 (120)
Fixed income funds ............................ 2,287 40 (1,026) (91) 1,210 124
Funds of hedge funds .......................... 6,344 (56) (370) — 5,918 (23)
Global macro funds ............................ 4 — — — 4 —
Multi-strategy funds ........................... 3,546 (100) (1,297) (26) 2,123 63
Other investment funds . . . . . . . . . . . . . . . . . . . . . . . . . 186 (19) (24) — 143 (19)
Private equity and debt investments ................. 8,037 839 (432) — 8,444 (12)
Real estate investments ........................... 5,508 799 (1,215) — 5,092 382
Total assets .................................... 30,931 1,626 (5,171) (124) 27,262 539
Liabilities
Corporate debt securities . . . . . . . . . . . . . . . . . . . . . . . . . . (2) — — 2 — —
Totalliabilities ................................. (2) — — 2 — —
Derivatives, net
Interest rate contracts .......................... (18) 25 — — 7 25
Foreign currency exchange contracts . . . . . . . . . . . . . . 1 — (1) — — —
Equity contracts ............................... (41) 50 (9) — — (1)
Credit contracts . . . . . . . . . . . . . . . . . . . . . . . . . . . . . . . (1) (4) (1) — (6) (7)
Total net assets ................................. $30,870 $1,697 $(5,182) $(122) $27,263 $ 556
General Motors Company 2011 Annual Report 139