General Motors 2011 Annual Report Download - page 117
Download and view the complete annual report
Please find page 117 of the 2011 General Motors annual report below. You can navigate through the pages in the report by either clicking on the pages listed below, or by using the keyword search tool below to find specific information within the annual report.-
 1
1 -
2
-
3
-
4
-
5
-
6
-
7
-
8
-
9
-
10
-
11
-
12
-
13
-
14
-
15
-
16
-
17
-
18
-
19
-
20
-
21
-
22
-
23
-
24
-
25
-
26
-
27
-
28
-
29
-
30
-
31
-
32
-
33
-
34
-
35
-
36
-
37
-
38
-
39
-
40
-
41
-
42
-
43
-
44
-
45
-
46
-
47
-
48
-
49
-
50
-
51
-
52
-
53
-
54
-
55
-
56
-
57
-
58
-
59
-
60
-
61
-
62
-
63
-
64
-
65
-
66
-
67
-
68
-
69
-
70
-
71
-
72
-
73
-
74
-
75
-
76
-
77
-
78
-
79
-
80
-
81
-
82
-
83
-
84
-
85
-
86
-
87
-
88
-
89
-
90
-
91
-
92
-
93
-
94
-
95
-
96
-
97
-
98
-
99
-
100
-
101
-
102
-
103
-
104
-
105
-
106
-
 107
107 -
 108
108 -
 109
109 -
 110
110 -
 111
111 -
 112
112 -
 113
113 -
 114
114 -
 115
115 -
 116
116 -
 117
117 -
 118
118 -
 119
119 -
 120
120 -
 121
121 -
 122
122 -
 123
123 -
 124
124 -
 125
125 -
 126
126 -
 127
127 -
128
-
129
-
130
-
131
-
132
-
133
-
134
-
135
-
136
-
137
-
138
-
139
-
140
-
141
-
142
-
143
-
144
-
145
-
146
-
147
-
148
-
149
-
150
-
151
-
152
-
153
-
154
-
155
-
156
-
157
-
158
-
159
-
160
-
161
-
162
-
163
-
164
-
165
-
166
-
167
-
168
-
169
-
170
-
171
-
172
-
173
-
174
-
175
-
176
-
177
-
178
-
179
-
180
-
181
-
182
-
183
-
184
-
185
-
186
-
187
-
188
-
189
-
190
-
191
-
192
-
193
-
194
-
195
-
196
-
197
-
198
-
199
-
200
 |
 |

GENERAL MOTORS COMPANY AND SUBSIDIARIES
NOTES TO CONSOLIDATED FINANCIAL STATEMENTS — (Continued)
In the three months ended December 31, 2011, 2010 and 2009 we performed our annual goodwill impairment testing as of
October 1 for all reporting units. Based on this testing we determined that goodwill was impaired for our GM Korea reporting unit at
October 1, 2011. Subsequent to our 2011 annual impairment testing we reversed a deferred tax asset valuation allowance for our GM
Holden, Ltd. (Holden) reporting unit that resulted in the carrying amount of this reporting unit exceeding its fair value and determined
that there was an event-driven impairment in our GM Korea reporting unit. As such we recorded Goodwill impairment charges of
$270 million in the three months ended December 31, 2011 within our GMIO segment. These goodwill impairment charges primarily
represent the decrease in the fair value-to-U.S. GAAP differences (which originated upon our application of fresh-start reporting in
2009) resulting from the reversal of valuation allowances in Holden.
The impairment charges recorded as a result of the initial adoption of ASU 2010-28 and the annual and event-driven goodwill
impairment tests in the year ended December 31, 2011 represent the net decreases in implied goodwill resulting primarily from
decreases in the fair value-to-U.S. GAAP differences attributable to those assets and liabilities that gave rise to goodwill upon our
application of fresh-start reporting. The net decreases resulted primarily from a decrease in our nonperformance risk and an
improvement in our incremental borrowing rates since July 10, 2009. At certain of the testing dates the net decrease also resulted from
an increase in the high quality corporate bond rates utilized to measure our employee benefit obligations and a decrease in credit
spreads between high quality corporate bond rates and market interest rates for companies with similar nonperformance risk. In
addition, for the purpose of deriving an implied goodwill balance, deterioration in the business outlook for certain reporting units
resulted in a reduction in the amount of deferred taxes giving rise to goodwill through the application of Accounting Standards
Codification (ASC) 805, “Business Combinations” (ASC 805) and an increase in estimated employee benefit obligations.
In the year ended December 31, 2011 our market capitalization (including the fair value of our preferred stock and warrants)
declined and at times it approximated our recorded Total equity. The fair values of our reporting units determined in our annual
goodwill impairment test decreased from the prior year, with the fair values of our GME and GM Korea reporting units decreasing
below their carrying amounts. The decrease in GME was driven primarily by a higher level of anticipated economic weakness in
Europe in the near- and medium-term. The decrease in GM Korea was driven by a higher level of anticipated economic weakness in
certain markets to which GM Korea exports coupled with lower forecasted margins resulting from higher raw material costs and
unfavorable foreign exchange rates.
The valuation methodologies utilized to perform our goodwill impairment testing were consistent with those used in our application
of fresh-start reporting on July 10, 2009 and in any subsequent annual or event-driven goodwill impairment tests and utilized Level 3
measures. Because the fair value of goodwill can be measured only as a residual amount and cannot be determined directly we
calculated the implied goodwill for those reporting units failing Step 1 in the same manner that goodwill is recognized in a business
combination pursuant to ASC 805.
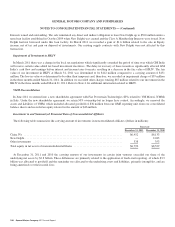
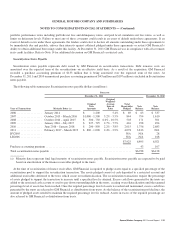
The following table summarizes the goodwill balances and key assumptions utilized for each of our reporting units that required a
Step 2 analysis (dollars and vehicles in millions):
Goodwill (b) WACC
Long-Term
Growth
Rates
Industry Sales (c) Market Share (c)
2011/2012 2015/2016 2011/2012 2015/2016
GME — At January 1, 2011 ...................... $3,053 17.0% 0.5% 18.4 22.0 6.6% 7.4%
GME — At March 31, 2011 ...................... $1,661 16.5% 0.5% 18.4 22.0 6.6% 7.4%
GME — At October 1, 2011 ...................... $1,246 17.5% 0.5% 19.4 21.7 6.7% 7.0%
GME — At December 31, 2011 ................... $1,193 18.5% 0.5% 19.4 22.3 6.3% 6.9%
GM Korea — At October 1, 2011 (a) . . . . . . . . . . . . . . . $ 615 15.5% 3.0% 81.0 97.1 1.4% 1.1%
GM Korea — At December 31, 2011 (a) . . . . . . . . . . . . $ 596 15.5% 3.0% 81.0 97.1 1.4% 1.1%
Holden — At December 31, 2011 . . . . . . . . . . . . . . . . . $ 197 14.0% 2.0% 1.2 1.3 12.5% 12.6%
(a) Industry sales and market share are based on global industry volumes because GM Korea exports vehicles globally.
(b) Goodwill balance is before any adjustments, if any, for goodwill impairments.
General Motors Company 2011 Annual Report 115