General Motors 2011 Annual Report Download - page 111
Download and view the complete annual report
Please find page 111 of the 2011 General Motors annual report below. You can navigate through the pages in the report by either clicking on the pages listed below, or by using the keyword search tool below to find specific information within the annual report.-
 1
1 -
2
-
3
-
4
-
5
-
6
-
7
-
8
-
9
-
10
-
11
-
12
-
13
-
14
-
15
-
16
-
17
-
18
-
19
-
20
-
21
-
22
-
23
-
24
-
25
-
26
-
27
-
28
-
29
-
30
-
31
-
32
-
33
-
34
-
35
-
36
-
37
-
38
-
39
-
40
-
41
-
42
-
43
-
44
-
45
-
46
-
47
-
48
-
49
-
50
-
51
-
52
-
53
-
54
-
55
-
56
-
57
-
58
-
59
-
60
-
61
-
62
-
63
-
64
-
65
-
66
-
67
-
68
-
69
-
70
-
71
-
72
-
73
-
74
-
75
-
76
-
77
-
78
-
79
-
80
-
81
-
82
-
83
-
84
-
85
-
86
-
87
-
88
-
89
-
90
-
91
-
92
-
93
-
94
-
95
-
96
-
97
-
98
-
99
-
100
-
 101
101 -
 102
102 -
 103
103 -
 104
104 -
 105
105 -
 106
106 -
 107
107 -
 108
108 -
 109
109 -
 110
110 -
 111
111 -
 112
112 -
 113
113 -
 114
114 -
 115
115 -
 116
116 -
 117
117 -
 118
118 -
 119
119 -
 120
120 -
 121
121 -
122
-
123
-
124
-
125
-
126
-
127
-
128
-
129
-
130
-
131
-
132
-
133
-
134
-
135
-
136
-
137
-
138
-
139
-
140
-
141
-
142
-
143
-
144
-
145
-
146
-
147
-
148
-
149
-
150
-
151
-
152
-
153
-
154
-
155
-
156
-
157
-
158
-
159
-
160
-
161
-
162
-
163
-
164
-
165
-
166
-
167
-
168
-
169
-
170
-
171
-
172
-
173
-
174
-
175
-
176
-
177
-
178
-
179
-
180
-
181
-
182
-
183
-
184
-
185
-
186
-
187
-
188
-
189
-
190
-
191
-
192
-
193
-
194
-
195
-
196
-
197
-
198
-
199
-
200
 |
 |

GENERAL MOTORS COMPANY AND SUBSIDIARIES
NOTES TO CONSOLIDATED FINANCIAL STATEMENTS — (Continued)
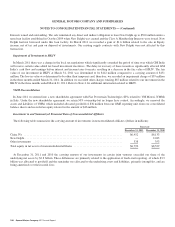
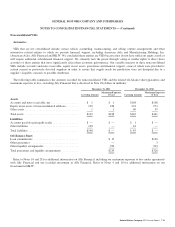
The following table presents summarized financial data for all of our nonconsolidated affiliates, excluding Ally Financial (dollars in
millions):
Successor
China JVs
December 31,
2011
Others
December 31,
2011
Total
December 31,
2011
China JVs
December 31,
2010
Others
December 31,
2010
Total
December 31,
2010
Summarized Balance Sheet Data
Current assets ............................ $10,882 $2,274 $13,156 $ 9,689 $ 9,708 $19,397
Non-current assets ......................... 5,293 1,863 7,156 4,147 5,001 9,148
Total assets .............................. $16,175 $4,137 $20,312 $13,836 $14,709 $28,545
Current liabilities ......................... $10,526 $1,492 $12,018 $ 8,931 $ 4,745 $13,676
Non-current liabilities . . . . . . . . . . . . . . . . . . . . . . 651 934 1,585 580 2,232 2,812
Total liabilities ........................... $11,177 $2,426 $13,603 $ 9,511 $ 6,977 $16,488
Non-controlling interests . . . . . . . . . . . . . . . . . . . $ 948 $ — $ 948 $ 766 $ 474 $ 1,240
Successor
Year Ended
December 31, 2011
Year Ended
December 31, 2010
Year Ended
December 31, 2009 (a)
Summarized Operating Data
China JV’s net sales ........................................... $30,511 $25,395 $18,098
Others’ net sales .............................................. 4,242 17,500 7,457
Total net sales ................................................ $34,753 $42,895 $25,555
China JV’s net income ......................................... $ 3,203 $ 2,808 $ 1,636
Others’ net income (loss) ....................................... (13) 656 161
Total net income .............................................. $ 3,190 $ 3,464 $ 1,797
(a) Summarized financial information is not included for a joint venture which remained with MLC at July 9, 2009. Old GM
recognized an equity loss of $243 million in the period January 1, 2009 through July 9, 2009.
Transactions with Nonconsolidated Affiliates
Nonconsolidated affiliates are involved in various aspects of the development, production and marketing of cars, trucks and
automobile parts, and we purchase component parts and vehicles from certain nonconsolidated affiliates for resale to dealers. The
following tables summarize the effects of transactions with nonconsolidated affiliates, excluding transactions with Ally Financial
which are disclosed in Note 28 (dollars in millions):
Successor Predecessor
Year Ended
December 31, 2011
Year Ended
December 31, 2010
July 10, 2009
Through
December 31, 2009
January 1, 2009
Through
July 9, 2009
Results of Operations
Automotive sales and revenue ............................. $3,266 $2,910 $ 899 $596
Automotive purchases, net ............................... $1,044 $2,881 $1,190 $737
Automotive selling, general and administrative expense . . . . . . . . $ 16 $ 3 $ (19) $ (19)
Automotive interest expense . . . . . . . . . . . . . . . . . . . . . . . . . . . . . . $ 20 $ 16 $ — $ —
Interest income and other non-operating income (expense), net . . . $ 34 $ 43 $ 14 $ (9)
General Motors Company 2011 Annual Report 109