General Motors 2011 Annual Report Download - page 136
Download and view the complete annual report
Please find page 136 of the 2011 General Motors annual report below. You can navigate through the pages in the report by either clicking on the pages listed below, or by using the keyword search tool below to find specific information within the annual report.-
 1
1 -
2
-
3
-
4
-
5
-
6
-
7
-
8
-
9
-
10
-
11
-
12
-
13
-
14
-
15
-
16
-
17
-
18
-
19
-
20
-
21
-
22
-
23
-
24
-
25
-
26
-
27
-
28
-
29
-
30
-
31
-
32
-
33
-
34
-
35
-
36
-
37
-
38
-
39
-
40
-
41
-
42
-
43
-
44
-
45
-
46
-
47
-
48
-
49
-
50
-
51
-
52
-
53
-
54
-
55
-
56
-
57
-
58
-
59
-
60
-
61
-
62
-
63
-
64
-
65
-
66
-
67
-
68
-
69
-
70
-
71
-
72
-
73
-
74
-
75
-
76
-
77
-
78
-
79
-
80
-
81
-
82
-
83
-
84
-
85
-
86
-
87
-
88
-
89
-
90
-
91
-
92
-
93
-
94
-
95
-
96
-
97
-
98
-
99
-
100
-
101
-
102
-
103
-
104
-
105
-
106
-
107
-
108
-
109
-
110
-
111
-
112
-
113
-
114
-
115
-
116
-
117
-
118
-
119
-
120
-
121
-
122
-
123
-
124
-
125
-
 126
126 -
 127
127 -
 128
128 -
 129
129 -
 130
130 -
 131
131 -
 132
132 -
 133
133 -
 134
134 -
 135
135 -
 136
136 -
 137
137 -
 138
138 -
 139
139 -
 140
140 -
 141
141 -
 142
142 -
 143
143 -
 144
144 -
 145
145 -
 146
146 -
147
-
148
-
149
-
150
-
151
-
152
-
153
-
154
-
155
-
156
-
157
-
158
-
159
-
160
-
161
-
162
-
163
-
164
-
165
-
166
-
167
-
168
-
169
-
170
-
171
-
172
-
173
-
174
-
175
-
176
-
177
-
178
-
179
-
180
-
181
-
182
-
183
-
184
-
185
-
186
-
187
-
188
-
189
-
190
-
191
-
192
-
193
-
194
-
195
-
196
-
197
-
198
-
199
-
200
 |
 |

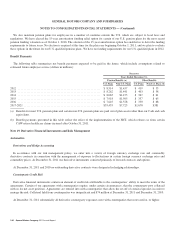
GENERAL MOTORS COMPANY AND SUBSIDIARIES
NOTES TO CONSOLIDATED FINANCIAL STATEMENTS — (Continued)
Predecessor
January 1, 2009 Through July 9, 2009
U.S. Plans
Pension Benefits
Non-U.S. Plans
Pension Benefits
U.S. Plans
Other Benefits
Non-U.S. Plans
Other Benefits
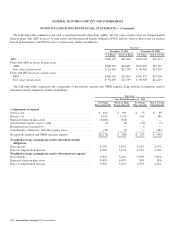
Components of expense
Servicecost ............................................... $ 243 $ 155 $ 69 $ 12
Interest cost ............................................... 3,077 596 1,615 102
Expected return on plan assets ................................ (3,810) (364) (444) —
Amortization of prior service cost (credit) . . . . . . . . . . . . . . . . . . . . . . . 429 (12) (1,051) (63)
Amortization of transition obligation ........................... — 2 — —
Recognition of net actuarial loss . . . . . . . . . . . . . . . . . . . . . . . . . . . . . . . 715 193 32 23
Curtailments, settlements, and other losses (gains) ................ 1,720 97 21 (123)
Net periodic pension and OPEB (income) expense ................ $2,374 $ 667 $ 242 $ (49)
Weighted-average assumptions used to determine benefit
obligations
Discount rate .............................................. 5.86% 5.82% 6.86% 5.47%
Rate of compensation increase ................................ 3.94% 3.23% 1.48% 4.45%
Weighted-average assumptions used to determine net expense
Discount rate .............................................. 6.27% 6.23% 8.11% 6.77%
Expected return on plan assets ................................ 8.50% 7.74% 8.50% N/A
Rate of compensation increase ................................ 5.00% 3.08% 1.87% 4.45%
U.S. pension plan service cost include administrative expenses of $138 million, $97 million, and $38 million for the years ended
December 31, 2011 and 2010, and the period July 10, 2009 through December 31, 2009. Weighted-average assumptions used to
determine net expense are determined at the beginning of the period and updated for remeasurements.
Assumptions
Healthcare Trend Rate
As a result of modifications made to healthcare plans in connection with the 363 Sale, there are no significant uncapped U.S.
healthcare plans remaining, therefore, the healthcare cost trend rate does not have a significant effect on our U.S. plans. The
implementation of the HCT at October 31, 2011 eliminated significant exposure to changes in the healthcare cost trend rate for
non-U.S. plans.
Successor
December 31,
2010
Assumed Healthcare Trend Rates Non-U.S. Plans
Initial healthcare cost trend rate ...................................................................... 5.6%
Ultimate healthcare cost trend rate .................................................................... 3.4%
Number of years to ultimate trend rate ................................................................ 8
Healthcare trend rate assumptions are determined for inclusion in healthcare OPEB valuation at each remeasurement. The
healthcare trend rates are developed using historical cash expenditures and near-term outlook for retiree healthcare. This information
is supplemented with information gathered from actuarial based models, information obtained from healthcare providers and known
significant events.
134 General Motors Company 2011 Annual Report