General Motors 2011 Annual Report Download - page 189
Download and view the complete annual report
Please find page 189 of the 2011 General Motors annual report below. You can navigate through the pages in the report by either clicking on the pages listed below, or by using the keyword search tool below to find specific information within the annual report.-
 1
1 -
2
-
3
-
4
-
5
-
6
-
7
-
8
-
9
-
10
-
11
-
12
-
13
-
14
-
15
-
16
-
17
-
18
-
19
-
20
-
21
-
22
-
23
-
24
-
25
-
26
-
27
-
28
-
29
-
30
-
31
-
32
-
33
-
34
-
35
-
36
-
37
-
38
-
39
-
40
-
41
-
42
-
43
-
44
-
45
-
46
-
47
-
48
-
49
-
50
-
51
-
52
-
53
-
54
-
55
-
56
-
57
-
58
-
59
-
60
-
61
-
62
-
63
-
64
-
65
-
66
-
67
-
68
-
69
-
70
-
71
-
72
-
73
-
74
-
75
-
76
-
77
-
78
-
79
-
80
-
81
-
82
-
83
-
84
-
85
-
86
-
87
-
88
-
89
-
90
-
91
-
92
-
93
-
94
-
95
-
96
-
97
-
98
-
99
-
100
-
101
-
102
-
103
-
104
-
105
-
106
-
107
-
108
-
109
-
110
-
111
-
112
-
113
-
114
-
115
-
116
-
117
-
118
-
119
-
120
-
121
-
122
-
123
-
124
-
125
-
126
-
127
-
128
-
129
-
130
-
131
-
132
-
133
-
134
-
135
-
136
-
137
-
138
-
139
-
140
-
141
-
142
-
143
-
144
-
145
-
146
-
147
-
148
-
149
-
150
-
151
-
152
-
153
-
154
-
155
-
156
-
157
-
158
-
159
-
160
-
161
-
162
-
163
-
164
-
165
-
166
-
167
-
168
-
169
-
170
-
171
-
172
-
173
-
174
-
175
-
176
-
177
-
178
-
 179
179 -
 180
180 -
 181
181 -
 182
182 -
 183
183 -
 184
184 -
 185
185 -
 186
186 -
 187
187 -
 188
188 -
 189
189 -
 190
190 -
 191
191 -
 192
192 -
 193
193 -
 194
194 -
 195
195 -
 196
196 -
 197
197 -
 198
198 -
 199
199 -
200
 |
 |

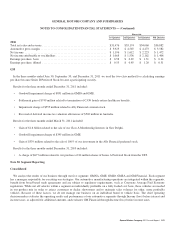
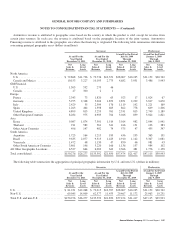
GENERAL MOTORS COMPANY AND SUBSIDIARIES
NOTES TO CONSOLIDATED FINANCIAL STATEMENTS — (Continued)
Automotive revenue is attributed to geographic areas based on the country in which the product is sold, except for revenue from
certain joint ventures. In such case, the revenue is attributed based on the geographic location of the joint venture. Automotive
Financing revenue is attributed to the geographic area where the financing is originated. The following table summarizes information
concerning principal geographic areas (dollars in millions):
Successor Predecessor
At and For the
Year Ended
December 31, 2011
At and For the
Year Ended
December 31, 2010
At and For the Period
July 10, 2009
Through
December 31, 2009
At and For the Period
January 1, 2009
Through
July 9, 2009
Net
Sales &
Revenue
Long
Lived
Assets
Net
Sales &
Revenue
Long
Lived
Assets
Net
Sales &
Revenue
Long
Lived
Assets
Net
Sales &
Revenue
Long
Lived
Assets
North America
U.S. .............................. $ 79,868 $11,736 $ 72,736 $10,351 $28,007 $10,245 $21,152 $20,742
Canada and Mexico ................. 10,153 3,227 10,195 2,773 4,682 3,031 3,486 5,943
GM Financial
U.S. .............................. 1,363 532 279 46
Canada............................ 47 300 2 1
Europe
France ............................ 2,343 73 1,820 63 923 17 1,024 67
Germany .......................... 5,975 2,348 5,004 1,852 2,851 2,299 3,817 3,670
Italy .............................. 2,429 55 2,509 176 1,119 192 1,221 169
Spain ............................. 1,263 464 1,398 665 862 778 609 1,206
United Kingdom .................... 4,899 815 5,253 761 2,531 815 2,749 1,189
Other European Countries ............ 8,284 975 6,905 764 3,046 839 3,024 1,821
Asia
Korea ............................. 9,087 1,874 7,301 1,519 3,014 982 2,044 1,941
Thailand . . . . . . . . . . . . . . . . . . . . . . . . . . 911 582 561 341 166 151 103 383
Other Asian Countries . . . . . . . . . . . . . . . 496 147 482 74 575 47 435 347
South America
Argentina ......................... 1,723 164 1,215 183 436 195 363 131
Brazil ............................. 9,635 2,077 9,513 1,425 4,910 1,142 3,347 1,081
Venezuela ......................... 1,472 48 1,130 47 850 46 981 43
Other South American Countries ....... 3,801 196 3,220 166 1,136 157 984 102
All Other Geographic Locations .......... 6,527 664 6,069 643 2,366 481 1,776 1,158
Total consolidated ..................... $150,276 $26,277 $135,592 $21,850 $57,474 $21,417 $47,115 $39,993
The following table summarizes the aggregation of principal geographic information by U.S. and non-U.S. (dollars in millions):
Successor Predecessor
At and For the
Year Ended
December 31, 2011
At and For the
Year Ended
December 31, 2010
At and For the Period
July 10, 2009
Through
December 31, 2009
At and For the Period
January 1, 2009
Through
July 9, 2009
Net
Sales &
Revenue
Long
Lived
Assets
Net
Sales &
Revenue
Long
Lived
Assets
Net
Sales &
Revenue
Long
Lived
Assets
Net
Sales &
Revenue
Long
Lived
Assets
U.S. ................................ $ 81,231 $12,268 $ 73,015 $10,397 $28,007 $10,245 $21,152 $20,742
Non-U.S. ............................ 69,045 14,009 62,577 11,453 29,467 11,172 25,963 19,251
Total U.S. and non-U.S. ................ $150,276 $26,277 $135,592 $21,850 $57,474 $21,417 $47,115 $39,993
General Motors Company 2011 Annual Report 187