General Motors 2011 Annual Report Download - page 132
Download and view the complete annual report
Please find page 132 of the 2011 General Motors annual report below. You can navigate through the pages in the report by either clicking on the pages listed below, or by using the keyword search tool below to find specific information within the annual report.-
 1
1 -
2
-
3
-
4
-
5
-
6
-
7
-
8
-
9
-
10
-
11
-
12
-
13
-
14
-
15
-
16
-
17
-
18
-
19
-
20
-
21
-
22
-
23
-
24
-
25
-
26
-
27
-
28
-
29
-
30
-
31
-
32
-
33
-
34
-
35
-
36
-
37
-
38
-
39
-
40
-
41
-
42
-
43
-
44
-
45
-
46
-
47
-
48
-
49
-
50
-
51
-
52
-
53
-
54
-
55
-
56
-
57
-
58
-
59
-
60
-
61
-
62
-
63
-
64
-
65
-
66
-
67
-
68
-
69
-
70
-
71
-
72
-
73
-
74
-
75
-
76
-
77
-
78
-
79
-
80
-
81
-
82
-
83
-
84
-
85
-
86
-
87
-
88
-
89
-
90
-
91
-
92
-
93
-
94
-
95
-
96
-
97
-
98
-
99
-
100
-
101
-
102
-
103
-
104
-
105
-
106
-
107
-
108
-
109
-
110
-
111
-
112
-
113
-
114
-
115
-
116
-
117
-
118
-
119
-
120
-
121
-
 122
122 -
 123
123 -
 124
124 -
 125
125 -
 126
126 -
 127
127 -
 128
128 -
 129
129 -
 130
130 -
 131
131 -
 132
132 -
 133
133 -
 134
134 -
 135
135 -
 136
136 -
 137
137 -
 138
138 -
 139
139 -
 140
140 -
 141
141 -
 142
142 -
143
-
144
-
145
-
146
-
147
-
148
-
149
-
150
-
151
-
152
-
153
-
154
-
155
-
156
-
157
-
158
-
159
-
160
-
161
-
162
-
163
-
164
-
165
-
166
-
167
-
168
-
169
-
170
-
171
-
172
-
173
-
174
-
175
-
176
-
177
-
178
-
179
-
180
-
181
-
182
-
183
-
184
-
185
-
186
-
187
-
188
-
189
-
190
-
191
-
192
-
193
-
194
-
195
-
196
-
197
-
198
-
199
-
200
 |
 |

GENERAL MOTORS COMPANY AND SUBSIDIARIES
NOTES TO CONSOLIDATED FINANCIAL STATEMENTS — (Continued)
surviving spouses by the class action process and to CAW active employees as of June 8, 2009. We accounted for the related
termination of CAW hourly retiree healthcare benefits as a settlement, and recorded a gain of $749 million as a component of
Automotive cost of sales. The settlement gain represents the difference between the healthcare plan obligation of $3.1 billion (as of
the implementation date) and the fair value of the notes and restricted cash contributed totaling $1.9 billion, and recognition of $414
million of accumulated other comprehensive losses.
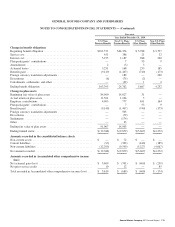
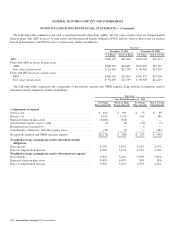
Pension and OPEB Obligations and Plan Assets
The following tables summarize the change in benefit obligations and related plan assets (dollars in millions):
Successor
Year Ended December 31, 2011
U.S. Plans
Pension Benefits
Non-U.S. Plans
Pension Benefits
U.S. Plans
Other Benefits
Non-U.S. Plans
Other Benefits
Change in benefit obligations
Beginning benefit obligation .................................. $103,395 $ 24,762 $ 5,667 $ 4,252
Servicecost ............................................... 494 399 23 30
Interest cost ............................................... 4,915 1,215 265 186
Plan participants’ contributions . . . . . . . . . . . . . . . . . . . . . . . . . . . . . . . . — 7 13 9
Amendments .............................................. (6) (10) (284) (2)
Actuarial losses ............................................ 8,494 1,530 548 343
Benefits paid .............................................. (8,730) (1,561) (439) (180)
Early retirement reinsurance program receipts . . . . . . . . . . . . . . . . . . . . — — 29 —
Foreign currency translation adjustments ........................ — (508) — (128)
Canadian healthcare trust settlement ............................ — — — (3,051)
Curtailments, settlements and other ............................ — (69) — 31
Ending benefit obligation .................................... 108,562 25,765 5,822 1,490
Change in plan assets
Beginning fair value of plan assets ............................. 91,007 14,903 — —
Actual return on plan assets .................................. 10,087 686 — —
Employer contributions ...................................... 1,962 836 426 171
Plan participants’ contributions . . . . . . . . . . . . . . . . . . . . . . . . . . . . . . . . — 7 13 9
Benefits paid .............................................. (8,730) (1,561) (439) (180)
Foreign currency translation adjustments ........................ — (258) — —
Settlements ............................................... — (34) — —
Other .................................................... 23 (38) — —
Ending fair value of plan assets ............................... 94,349 14,541 — —
Ending funded status ........................................ $(14,213) $(11,224) $(5,822) $(1,490)
Amounts recorded in the consolidated balance sheets
Non-currentassets .......................................... $ — $ 61 $ — $ —
Current liabilities ........................................... (99) (324) (411) (65)
Non-current liabilities ....................................... (14,114) (10,961) (5,411) (1,425)
Net amount recorded ........................................ $(14,213) $(11,224) $(5,822) $(1,490)
Amounts recorded in Accumulated other comprehensive income
(loss)
Net actuarial loss ........................................... $ (1,352) $ (2,498) $(1,003) $ (177)
Netpriorservicecredit ...................................... 15 19 251 76
Total recorded in Accumulated other comprehensive income (loss) . . . $ (1,337) $ (2,479) $ (752) $ (101)
130 General Motors Company 2011 Annual Report