General Motors 2011 Annual Report Download - page 85
Download and view the complete annual report
Please find page 85 of the 2011 General Motors annual report below. You can navigate through the pages in the report by either clicking on the pages listed below, or by using the keyword search tool below to find specific information within the annual report.-
 1
1 -
2
-
3
-
4
-
5
-
6
-
7
-
8
-
9
-
10
-
11
-
12
-
13
-
14
-
15
-
16
-
17
-
18
-
19
-
20
-
21
-
22
-
23
-
24
-
25
-
26
-
27
-
28
-
29
-
30
-
31
-
32
-
33
-
34
-
35
-
36
-
37
-
38
-
39
-
40
-
41
-
42
-
43
-
44
-
45
-
46
-
47
-
48
-
49
-
50
-
51
-
52
-
53
-
54
-
55
-
56
-
57
-
58
-
59
-
60
-
61
-
62
-
63
-
64
-
65
-
66
-
67
-
68
-
69
-
70
-
71
-
72
-
73
-
74
-
 75
75 -
 76
76 -
 77
77 -
 78
78 -
 79
79 -
 80
80 -
 81
81 -
 82
82 -
 83
83 -
 84
84 -
 85
85 -
 86
86 -
 87
87 -
 88
88 -
 89
89 -
 90
90 -
 91
91 -
 92
92 -
 93
93 -
 94
94 -
 95
95 -
96
-
97
-
98
-
99
-
100
-
101
-
102
-
103
-
104
-
105
-
106
-
107
-
108
-
109
-
110
-
111
-
112
-
113
-
114
-
115
-
116
-
117
-
118
-
119
-
120
-
121
-
122
-
123
-
124
-
125
-
126
-
127
-
128
-
129
-
130
-
131
-
132
-
133
-
134
-
135
-
136
-
137
-
138
-
139
-
140
-
141
-
142
-
143
-
144
-
145
-
146
-
147
-
148
-
149
-
150
-
151
-
152
-
153
-
154
-
155
-
156
-
157
-
158
-
159
-
160
-
161
-
162
-
163
-
164
-
165
-
166
-
167
-
168
-
169
-
170
-
171
-
172
-
173
-
174
-
175
-
176
-
177
-
178
-
179
-
180
-
181
-
182
-
183
-
184
-
185
-
186
-
187
-
188
-
189
-
190
-
191
-
192
-
193
-
194
-
195
-
196
-
197
-
198
-
199
-
200
 |
 |

GENERAL MOTORS COMPANY AND SUBSIDIARIES
NOTES TO CONSOLIDATED FINANCIAL STATEMENTS — (Continued)
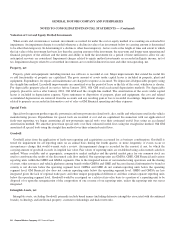
Research and Development Expenditures
The following table summarizes research and development expenditures, which are expensed as incurred (dollars in millions):
Successor Predecessor
Year Ended
December 31, 2011
Year Ended
December 31, 2010
July 10, 2009
Through
December 31, 2009
January 1, 2009
Through
July 9, 2009
Research and development expense ................... $8,124 $6,962 $3,034 $3,017
Cash Equivalents
Cash equivalents are defined as short-term, highly-liquid investments with original maturities of 90 days or less.
Fair Value Measurements
A three-level valuation hierarchy, based upon observable and unobservable inputs, is used for fair value measurements. Observable
inputs reflect market data obtained from independent sources, while unobservable inputs reflect market assumptions based on the best
evidence available. These two types of inputs create the following fair value hierarchy:
• Level 1 — Quoted prices for identical instruments in active markets;
• Level 2 — Quoted prices for similar instruments in active markets; quoted prices for identical or similar instruments in
markets that are not active; and model-derived valuations whose significant inputs are observable; and
• Level 3 — Instruments whose significant inputs are unobservable.
Financial instruments are transferred in and/or out of Level 1, 2 or 3 at the beginning of the accounting period in which there is a
change in the valuation inputs.
Marketable Securities
We classify marketable securities as available-for-sale or trading. Various factors, including turnover of holdings and investment
guidelines, are considered in determining the classification of securities. Available-for-sale securities are recorded at fair value with
unrealized gains and losses recorded, net of related income taxes, in Accumulated other comprehensive income until realized. Trading
securities are recorded at fair value with changes in fair value recorded in Interest income and other non-operating income, net. We
determine realized gains and losses for all securities using the specific identification method.
Securities are classified in Level 1 when quoted prices in an active market for identical securities are available. If quoted market
prices are not available, fair values of securities are determined using prices from a pricing service, pricing models, quoted prices of
securities with similar characteristics or discounted cash flow models and are generally classified in Level 2. These prices represent
non-binding quotes. U.S. government and agency securities, sovereign debt, certificates of deposit, and corporate debt securities are
classified as Level 2. Our pricing vendor utilizes industry-standard pricing models that consider various inputs, including benchmark
yields, reported trades, broker/dealer quotes, issuer spreads and benchmark securities as well as other relevant economic measures.
Securities are classified in Level 3 in certain cases where there are unobservable inputs to the valuation in the marketplace. Level 3
financial instruments typically include, in addition to the unobservable inputs, observable components that are validated to external
sources.
We measure fair value of our marketable securities using a market approach where identical or comparable prices are available, and
an income approach in other cases. We obtain the majority of the prices used in this valuation from a pricing service. We conduct an
General Motors Company 2011 Annual Report 83