General Motors 2011 Annual Report Download - page 115
Download and view the complete annual report
Please find page 115 of the 2011 General Motors annual report below. You can navigate through the pages in the report by either clicking on the pages listed below, or by using the keyword search tool below to find specific information within the annual report.-
 1
1 -
2
-
3
-
4
-
5
-
6
-
7
-
8
-
9
-
10
-
11
-
12
-
13
-
14
-
15
-
16
-
17
-
18
-
19
-
20
-
21
-
22
-
23
-
24
-
25
-
26
-
27
-
28
-
29
-
30
-
31
-
32
-
33
-
34
-
35
-
36
-
37
-
38
-
39
-
40
-
41
-
42
-
43
-
44
-
45
-
46
-
47
-
48
-
49
-
50
-
51
-
52
-
53
-
54
-
55
-
56
-
57
-
58
-
59
-
60
-
61
-
62
-
63
-
64
-
65
-
66
-
67
-
68
-
69
-
70
-
71
-
72
-
73
-
74
-
75
-
76
-
77
-
78
-
79
-
80
-
81
-
82
-
83
-
84
-
85
-
86
-
87
-
88
-
89
-
90
-
91
-
92
-
93
-
94
-
95
-
96
-
97
-
98
-
99
-
100
-
101
-
102
-
103
-
104
-
 105
105 -
 106
106 -
 107
107 -
 108
108 -
 109
109 -
 110
110 -
 111
111 -
 112
112 -
 113
113 -
 114
114 -
 115
115 -
 116
116 -
 117
117 -
 118
118 -
 119
119 -
 120
120 -
 121
121 -
 122
122 -
 123
123 -
 124
124 -
 125
125 -
126
-
127
-
128
-
129
-
130
-
131
-
132
-
133
-
134
-
135
-
136
-
137
-
138
-
139
-
140
-
141
-
142
-
143
-
144
-
145
-
146
-
147
-
148
-
149
-
150
-
151
-
152
-
153
-
154
-
155
-
156
-
157
-
158
-
159
-
160
-
161
-
162
-
163
-
164
-
165
-
166
-
167
-
168
-
169
-
170
-
171
-
172
-
173
-
174
-
175
-
176
-
177
-
178
-
179
-
180
-
181
-
182
-
183
-
184
-
185
-
186
-
187
-
188
-
189
-
190
-
191
-
192
-
193
-
194
-
195
-
196
-
197
-
198
-
199
-
200
 |
 |

GENERAL MOTORS COMPANY AND SUBSIDIARIES
NOTES TO CONSOLIDATED FINANCIAL STATEMENTS — (Continued)
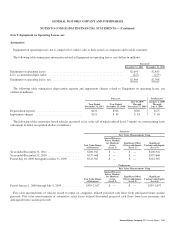
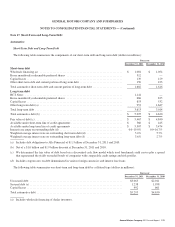
Note 11. Property, net
Automotive
The following table summarizes the components of Property, net (dollars in millions):
Successor
Estimated
Useful Lives
(Years)
December 31,
2011
December 31,
2010
Land ...................................................................... — $ 2,496 $ 2,536
Buildings and improvements ................................................... 5-40 4,670 4,324
Machinery and equipment ..................................................... 3-27 10,651 8,727
Construction in progress ....................................................... — 3,068 1,754
Real estate, plants, and equipment ............................................... 20,885 17,341
Less: accumulated depreciation ................................................. (4,601) (3,277)
Real estate, plants, and equipment, net ............................................ 16,284 14,064
Special tools, net ............................................................. 1-15 6,673 5,171
Total property, net ........................................................... $22,957 $19,235
The following table summarizes the amount of interest capitalized and excluded from Automotive interest expense related to
Property, net (dollars in millions):
Successor Predecessor
Year Ended
December 31, 2011
Year Ended
December 31, 2010
July 10, 2009
Through
December 31, 2009
January 1, 2009
Through
July 9, 2009
Capitalizedinterest .................................. $91 $62 $21 $28
The following table summarizes the amount of capitalized software included in Property, net (dollars in millions):
Successor
December 31, 2011 December 31, 2010
Capitalized software in use, net .................................................... $276 $287
Capitalized software in the process of being developed .................................. $111 $ 96
The following table summarizes depreciation, impairment charges and amortization expense related to Property, net, recorded in
Automotive cost of sales, Automotive selling, general and administrative expense and Other automotive expenses, net (dollars in millions):
Successor Predecessor
Year Ended
December 31, 2011
Year Ended
December 31, 2010
July 10, 2009
Through
December 31, 2009
January 1, 2009
Through
July 9, 2009
Depreciation and amortization of long-lived assets ......... $3,596 $3,574 $2,218 $5,925
Impairment charges of long-lived assets (a) . . . . . . . . . . . . . . . 81 240 2 566
Total depreciation, impairment charges and amortization
expense ......................................... $3,677 $3,814 $2,220 $6,491
Capitalized software amortization expense (b) . . . . . . . . . . . . . $ 202 $ 195 $ 132 $ 136
(a) The fair value of related assets was determined to be $0 in the years ended December 31, 2011 and 2010 and the period from
July 10, 2009 through December 31, 2009 and $0 to $85 million in the period from January 1, 2009 through July 9, 2009
General Motors Company 2011 Annual Report 113