General Motors 2011 Annual Report Download - page 36
Download and view the complete annual report
Please find page 36 of the 2011 General Motors annual report below. You can navigate through the pages in the report by either clicking on the pages listed below, or by using the keyword search tool below to find specific information within the annual report.-
 1
1 -
2
-
3
-
4
-
5
-
6
-
7
-
8
-
9
-
10
-
11
-
12
-
13
-
14
-
15
-
16
-
17
-
18
-
19
-
20
-
21
-
22
-
23
-
24
-
25
-
 26
26 -
 27
27 -
 28
28 -
 29
29 -
 30
30 -
 31
31 -
 32
32 -
 33
33 -
 34
34 -
 35
35 -
 36
36 -
 37
37 -
 38
38 -
 39
39 -
 40
40 -
 41
41 -
 42
42 -
 43
43 -
 44
44 -
 45
45 -
 46
46 -
47
-
48
-
49
-
50
-
51
-
52
-
53
-
54
-
55
-
56
-
57
-
58
-
59
-
60
-
61
-
62
-
63
-
64
-
65
-
66
-
67
-
68
-
69
-
70
-
71
-
72
-
73
-
74
-
75
-
76
-
77
-
78
-
79
-
80
-
81
-
82
-
83
-
84
-
85
-
86
-
87
-
88
-
89
-
90
-
91
-
92
-
93
-
94
-
95
-
96
-
97
-
98
-
99
-
100
-
101
-
102
-
103
-
104
-
105
-
106
-
107
-
108
-
109
-
110
-
111
-
112
-
113
-
114
-
115
-
116
-
117
-
118
-
119
-
120
-
121
-
122
-
123
-
124
-
125
-
126
-
127
-
128
-
129
-
130
-
131
-
132
-
133
-
134
-
135
-
136
-
137
-
138
-
139
-
140
-
141
-
142
-
143
-
144
-
145
-
146
-
147
-
148
-
149
-
150
-
151
-
152
-
153
-
154
-
155
-
156
-
157
-
158
-
159
-
160
-
161
-
162
-
163
-
164
-
165
-
166
-
167
-
168
-
169
-
170
-
171
-
172
-
173
-
174
-
175
-
176
-
177
-
178
-
179
-
180
-
181
-
182
-
183
-
184
-
185
-
186
-
187
-
188
-
189
-
190
-
191
-
192
-
193
-
194
-
195
-
196
-
197
-
198
-
199
-
200
 |
 |
GENERAL MOTORS COMPANY AND SUBSIDIARIES
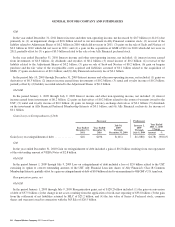
GMNA Total Net Sales and Revenue
In the year ended December 31, 2011 Total net sales and revenue increased by $7.2 billion (or 8.7%) due primarily to: (1) increased
wholesale volumes of $7.3 billion representing 299,000 vehicles (or 10.3%) due to increased industry demand and successful recent
vehicle launches such as the Chevrolet Cruze, Chevrolet Equinox and GMC Terrain; (2) favorable vehicle pricing of $1.1 billion;
(3) increased revenues from Customer Care and Aftersales of $0.4 billion due to increased volumes; and (4) favorable net foreign
currency remeasurement of $0.3 billion due to the strengthening of the Canadian Dollar against the U.S. Dollar; partially offset by
(5) unfavorable vehicle mix of $1.1 billion; and (6) decreased revenue of $1.0 billion due to the sale of Nexteer in November 2010.
In the year ended December 31, 2010 Total net sales and revenue increased by $26.4 billion (or 46.7%) due primarily to:
(1) increased wholesale volumes of $19.8 billion representing 873,000 vehicles (or 42.7%) due to an improving economy and
successful recent vehicle launches of the Chevrolet Equinox, Chevrolet Cruze, GMC Terrain, Buick LaCrosse and Cadillac SRX;
(2) favorable pricing of $2.9 billion due to decreased sales allowances partially offset by less favorable adjustments in the U.S. to the
accrual for U.S. residual support programs for leased vehicles of $0.4 billion (favorable of $0.7 billion in the year ended
December 31, 2010 compared to favorable of $1.1 billion in 2009); (3) favorable vehicle mix of $1.6 billion due to increased
crossover and truck sales; (4) increased sales of $1.0 billion due to the acquisition of Nexteer and four domestic component
manufacturing facilities; (5) favorable net foreign currency remeasurement of $0.8 billion due to the strengthening of the Canadian
Dollar against the U.S. Dollar; and (6) increased revenues from OnStar of $0.3 billion due to increased volumes.
GMNA EBIT (Loss)-Adjusted
In the year ended December 31, 2011 EBIT-adjusted increased by $1.5 billion (or 26.5%) due primarily to: (1) increased net
wholesale volumes of $1.9 billion due to increased industry demand and successful recent vehicle launches; (2) favorable vehicle
pricing effect of $1.1 billion; (3) decreased amortization expense of $0.7 billion due to the effect of double-declining amortization of
technology intangibles which were recorded on July 10, 2009 and impairment charges for long-lived assets in 2010; (4) favorable
foreign currency remeasurement of $0.5 billion due to the weakening of the Canadian Dollar against the U.S. Dollar; and (5) increase
in net pension and OPEB income of $0.3 billion due to December 31, 2010 plan remeasurements; partially offset by (6) unfavorable
net vehicle mix of $1.8 billion; (7) increased engineering expense and other technology fees of $0.5 billion to support new product
development; (8) increased material prices and freight of $0.4 billion; and (9) reduction in favorable adjustments of $0.4 billion to
restructuring reserves due to increased production capacity utilization and revisions to productivity initiatives in 2010.
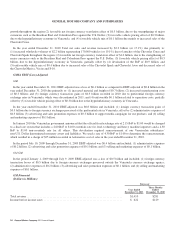
In the year ended December 31, 2010 EBIT-adjusted was $5.7 billion and included: (1) favorable adjustments of $0.4 billion to
restructuring reserves due primarily to increased production capacity utilization, which resulted in the recall of idled employees to fill
added shifts at multiple U.S. production sites and revisions to productivity initiatives; offset by (2) advertising and sales promotion
expenses of $3.4 billion to support media campaigns for our products; (3) administrative expenses of $2.0 billion; (4) selling and
marketing expenses of $0.6 billion related to our dealerships; (5) foreign currency remeasurement losses of $0.5 billion due to the
strengthening of the Canadian Dollar against the U.S. Dollar; (6) charges of $0.2 billion for a recall campaign on windshield fluid
heaters; and (7) impairment charges related to long-lived assets of $0.2 billion.
In the period July 10, 2009 through December 31, 2009 EBIT-adjusted was a loss of $2.1 billion and included: (1) foreign currency
remeasurement losses of $1.3 billion due to the strengthening of the Canadian Dollar against the U.S. Dollar; (2) charges of $0.3
billion related to dealer wind-down costs for our Saturn dealers after plans to sell the Saturn brand and dealerships network were
terminated; partially offset by (3) favorable adjustments in Automotive cost of sales of $0.7 billion due to the sell through of inventory
acquired from Old GM at July 10, 2009.
Old GM
In the period January 1, 2009 through July 9, 2009 EBIT-adjusted was a loss of $11.1 billion and included: (1) incremental
depreciation charges of $2.1 billion for facilities included in GMNA’s restructuring activities and for certain facilities that MLC
retained; (2) curtailment loss of $1.7 billion upon the interim remeasurement of the U.S. hourly and U.S. salaried defined benefit
34 General Motors Company 2011 Annual Report