General Motors 2011 Annual Report Download - page 103
Download and view the complete annual report
Please find page 103 of the 2011 General Motors annual report below. You can navigate through the pages in the report by either clicking on the pages listed below, or by using the keyword search tool below to find specific information within the annual report.-
 1
1 -
2
-
3
-
4
-
5
-
6
-
7
-
8
-
9
-
10
-
11
-
12
-
13
-
14
-
15
-
16
-
17
-
18
-
19
-
20
-
21
-
22
-
23
-
24
-
25
-
26
-
27
-
28
-
29
-
30
-
31
-
32
-
33
-
34
-
35
-
36
-
37
-
38
-
39
-
40
-
41
-
42
-
43
-
44
-
45
-
46
-
47
-
48
-
49
-
50
-
51
-
52
-
53
-
54
-
55
-
56
-
57
-
58
-
59
-
60
-
61
-
62
-
63
-
64
-
65
-
66
-
67
-
68
-
69
-
70
-
71
-
72
-
73
-
74
-
75
-
76
-
77
-
78
-
79
-
80
-
81
-
82
-
83
-
84
-
85
-
86
-
87
-
88
-
89
-
90
-
91
-
92
-
 93
93 -
 94
94 -
 95
95 -
 96
96 -
 97
97 -
 98
98 -
 99
99 -
 100
100 -
 101
101 -
 102
102 -
 103
103 -
 104
104 -
 105
105 -
 106
106 -
 107
107 -
 108
108 -
 109
109 -
 110
110 -
 111
111 -
 112
112 -
 113
113 -
114
-
115
-
116
-
117
-
118
-
119
-
120
-
121
-
122
-
123
-
124
-
125
-
126
-
127
-
128
-
129
-
130
-
131
-
132
-
133
-
134
-
135
-
136
-
137
-
138
-
139
-
140
-
141
-
142
-
143
-
144
-
145
-
146
-
147
-
148
-
149
-
150
-
151
-
152
-
153
-
154
-
155
-
156
-
157
-
158
-
159
-
160
-
161
-
162
-
163
-
164
-
165
-
166
-
167
-
168
-
169
-
170
-
171
-
172
-
173
-
174
-
175
-
176
-
177
-
178
-
179
-
180
-
181
-
182
-
183
-
184
-
185
-
186
-
187
-
188
-
189
-
190
-
191
-
192
-
193
-
194
-
195
-
196
-
197
-
198
-
199
-
200
 |
 |

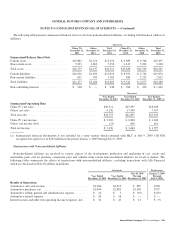
GENERAL MOTORS COMPANY AND SUBSIDIARIES
NOTES TO CONSOLIDATED FINANCIAL STATEMENTS — (Continued)
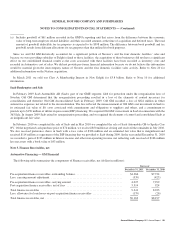
The following table summarizes activity for the allowance for post-acquisition loan losses (dollars in millions):
Successor
Year Ended
December 31, 2011
October 1, 2010
Through
December 31, 2010
Balanceatbeginningofperiod ..................................................... $ 26 $—
Provisionforloanlosses .......................................................... 178 26
Charge-offs .................................................................... (66) —
Recoveries ..................................................................... 41 —
Balance at end of period .......................................................... $179 $26
Credit Quality
Credit bureau scores, generally referred to as FICO scores, are determined during GM Financial’s automotive loan origination
process. The following table summarizes the credit risk profile of finance receivables by FICO score band, determined at origination
(dollars in millions):
Successor
December 31, 2011 December 31, 2010
FICO score less than 540 ......................................................... $2,133 $1,328
FICO score 540 to 599 ........................................................... 4,167 3,396
FICO score 600 to 659 ........................................................... 2,624 2,758
FICOscoregreaterthan660 ....................................................... 756 1,166
Balance at end of period (a) ....................................................... $9,680 $8,648
(a) Balance at end of period is the sum of pre-acquisition finance receivables — outstanding balance and post-acquisition finance
receivables, net of fees.
Delinquency
The following summarizes the contractual amount of finance receivables, which is not materially different than the recorded
investment, more than 30 days delinquent, but not yet in repossession, and in repossession, but not yet charged off (dollars in
millions):
Successor
December 31, 2011 December 31, 2010
Amount
Percent of
Contractual
Amount Due Amount
Percent of
Contractual
Amount Due
Delinquent contracts
31-to-60 days ............................................................ $517 5.3% $535 6.2%
Greater-than-60days ...................................................... 182 1.9% 212 2.4%
Total finance receivables more than 30 days delinquent . . . . . . . . . . . . . . . . . . . . . . . . . . 699 7.2% 747 8.6%
Inrepossession .......................................................... 27 0.3% 28 0.3%
Total finance receivables more than 30 days delinquent and in repossession .......... $726 7.5% $775 8.9%
An account is considered delinquent if a substantial portion of a scheduled payment has not been received by the date such payment
was contractually due. Delinquencies may vary from period to period based upon the average age of the portfolio, seasonality within
the calendar year and economic factors.
General Motors Company 2011 Annual Report 101