General Motors 2011 Annual Report Download - page 56
Download and view the complete annual report
Please find page 56 of the 2011 General Motors annual report below. You can navigate through the pages in the report by either clicking on the pages listed below, or by using the keyword search tool below to find specific information within the annual report.-
 1
1 -
2
-
3
-
4
-
5
-
6
-
7
-
8
-
9
-
10
-
11
-
12
-
13
-
14
-
15
-
16
-
17
-
18
-
19
-
20
-
21
-
22
-
23
-
24
-
25
-
26
-
27
-
28
-
29
-
30
-
31
-
32
-
33
-
34
-
35
-
36
-
37
-
38
-
39
-
40
-
41
-
42
-
43
-
44
-
45
-
 46
46 -
 47
47 -
 48
48 -
 49
49 -
 50
50 -
 51
51 -
 52
52 -
 53
53 -
 54
54 -
 55
55 -
 56
56 -
 57
57 -
 58
58 -
 59
59 -
 60
60 -
 61
61 -
 62
62 -
 63
63 -
 64
64 -
 65
65 -
 66
66 -
67
-
68
-
69
-
70
-
71
-
72
-
73
-
74
-
75
-
76
-
77
-
78
-
79
-
80
-
81
-
82
-
83
-
84
-
85
-
86
-
87
-
88
-
89
-
90
-
91
-
92
-
93
-
94
-
95
-
96
-
97
-
98
-
99
-
100
-
101
-
102
-
103
-
104
-
105
-
106
-
107
-
108
-
109
-
110
-
111
-
112
-
113
-
114
-
115
-
116
-
117
-
118
-
119
-
120
-
121
-
122
-
123
-
124
-
125
-
126
-
127
-
128
-
129
-
130
-
131
-
132
-
133
-
134
-
135
-
136
-
137
-
138
-
139
-
140
-
141
-
142
-
143
-
144
-
145
-
146
-
147
-
148
-
149
-
150
-
151
-
152
-
153
-
154
-
155
-
156
-
157
-
158
-
159
-
160
-
161
-
162
-
163
-
164
-
165
-
166
-
167
-
168
-
169
-
170
-
171
-
172
-
173
-
174
-
175
-
176
-
177
-
178
-
179
-
180
-
181
-
182
-
183
-
184
-
185
-
186
-
187
-
188
-
189
-
190
-
191
-
192
-
193
-
194
-
195
-
196
-
197
-
198
-
199
-
200
 |
 |

GENERAL MOTORS COMPANY AND SUBSIDIARIES
(g) Future payments in local currency amounts were translated into U.S. Dollars using the balance sheet spot rate at December 31, 2011.
(h) Amounts do not include future cash payments for long-term purchase obligations and other accrued expenditures (unless
specifically listed in the table above) which were recorded in Accounts payable or Accrued liabilities at December 31, 2011.
(i) Amounts exclude the future annual contingent obligations of Euro 265 million in the years 2012 to 2014 related to our Opel/
Vauxhall restructuring plan.
(j) Amount includes all expected future payments for both current and expected future service at December 31, 2011 for other
postretirement benefit obligations for salaried employees and hourly other postretirement benefit obligations extending beyond
the current North American union contract agreements. Amounts do not include pension funding obligations, which are
discussed below under the caption “Pension Funding Requirements.”
The table above does not reflect unrecognized tax benefits of $2.4 billion due to the high degree of uncertainty regarding the future
cash outflows associated with these amounts.
Pension Funding Requirements
The next pension funding valuation to be prepared based on the requirements of the Pension Protection Act of 2006 (PPA) will be
as of October 1, 2011. Based on the PPA, we have the option to select a funding interest rate for the valuation based on either the Full
Yield Curve method or the 3-Segment method, both of which are considered to be acceptable methods. A hypothetical valuation at
December 31, 2011 using the 3-Segment rate at May 31, 2011 for the plan year beginning October 1, 2011 and assuming either the
Full Yield Curve rate or the 3-Segment rate at December 31, 2011 for all future valuations, projects no funding requirements through
2017. We have assumed that the pension plans in the future earn the expected return on assets of 5.7% for the salaried plan and 6.5%
for the hourly plan. The valuation projections also assume that additional benefit accruals in the salaried plan will cease effective
September 30, 2012. Refer to Note 18 of our consolidated financial statements for additional information.
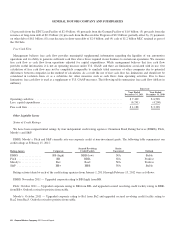
The funding interest rate and return on assets rate sensitivities for projected pension funding requirements are shown below (in
billions):
Funding Interest Rate Sensitivity Table
Estimated
Return on
Assets - 100
basis point
decrease
50 basis
point increase
25 basis
point increase Base Line
25 basis
point decrease
50 basis
point decrease
2012-2015 ................................. $— $— $— $— $— $—
2016 ...................................... $— $— $— $— $1.5 $—
2017 ...................................... $— $— $— $1.5 $3.3 $0.9
The funding interest rate and return on assets rate sensitivities in the hypothetical valuation consider our 2010 plan year election of
relief for certain of our U.S. pension plans but do not consider the potential election of relief provisions that are available to us for the
2011 plan year under the Pension Relief Act of 2010 for our U.S. qualified pension plans. Refer to Note 18 to our consolidated
financial statements for additional information regarding our pension funding requirements.
We do not have any required contributions payable to our U.S. qualified plans in 2012. We expect to contribute $100 million to our
U.S. non-qualified plans and $740 million to our non-U.S. pension plans in 2012.
Fair Value Measurements
Automotive
At December 31, 2011 and 2010 assets and liabilities classified in Level 3 were not significant. Prior to the three months ended
December 31, 2010 significant assets and liabilities classified in Level 3, with the related Level 3 inputs, were as follows:
• Foreign currency derivatives — Level 3 inputs used to determine the fair value of foreign currency derivative liabilities
include the appropriate credit spread to measure our nonperformance risk. Given our nonperformance risk was not observable
54 General Motors Company 2011 Annual Report