General Motors 2011 Annual Report Download - page 183
Download and view the complete annual report
Please find page 183 of the 2011 General Motors annual report below. You can navigate through the pages in the report by either clicking on the pages listed below, or by using the keyword search tool below to find specific information within the annual report.-
 1
1 -
2
-
3
-
4
-
5
-
6
-
7
-
8
-
9
-
10
-
11
-
12
-
13
-
14
-
15
-
16
-
17
-
18
-
19
-
20
-
21
-
22
-
23
-
24
-
25
-
26
-
27
-
28
-
29
-
30
-
31
-
32
-
33
-
34
-
35
-
36
-
37
-
38
-
39
-
40
-
41
-
42
-
43
-
44
-
45
-
46
-
47
-
48
-
49
-
50
-
51
-
52
-
53
-
54
-
55
-
56
-
57
-
58
-
59
-
60
-
61
-
62
-
63
-
64
-
65
-
66
-
67
-
68
-
69
-
70
-
71
-
72
-
73
-
74
-
75
-
76
-
77
-
78
-
79
-
80
-
81
-
82
-
83
-
84
-
85
-
86
-
87
-
88
-
89
-
90
-
91
-
92
-
93
-
94
-
95
-
96
-
97
-
98
-
99
-
100
-
101
-
102
-
103
-
104
-
105
-
106
-
107
-
108
-
109
-
110
-
111
-
112
-
113
-
114
-
115
-
116
-
117
-
118
-
119
-
120
-
121
-
122
-
123
-
124
-
125
-
126
-
127
-
128
-
129
-
130
-
131
-
132
-
133
-
134
-
135
-
136
-
137
-
138
-
139
-
140
-
141
-
142
-
143
-
144
-
145
-
146
-
147
-
148
-
149
-
150
-
151
-
152
-
153
-
154
-
155
-
156
-
157
-
158
-
159
-
160
-
161
-
162
-
163
-
164
-
165
-
166
-
167
-
168
-
169
-
170
-
171
-
172
-
 173
173 -
 174
174 -
 175
175 -
 176
176 -
 177
177 -
 178
178 -
 179
179 -
 180
180 -
 181
181 -
 182
182 -
 183
183 -
 184
184 -
 185
185 -
 186
186 -
 187
187 -
 188
188 -
 189
189 -
 190
190 -
 191
191 -
 192
192 -
 193
193 -
194
-
195
-
196
-
197
-
198
-
199
-
200
 |
 |

GENERAL MOTORS COMPANY AND SUBSIDIARIES
NOTES TO CONSOLIDATED FINANCIAL STATEMENTS — (Continued)
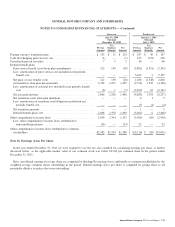
Successor
1st Quarter 2nd Quarter 3rd Quarter 4th Quarter
2010
Total net sales and revenue ............................................. $31,476 $33,174 $34,060 $36,882
Automotive gross margin .............................................. $ 3,923 $ 4,565 $ 4,473 $ 3,582
Net income ......................................................... $ 1,196 $ 1,612 $ 2,223 $ 1,472
Net income attributable to stockholders ................................... $ 1,068 $ 1,536 $ 2,162 $ 1,406
Earnings per share, basic .............................................. $ 0.58 $ 0.89 $ 1.31 $ 0.34
Earnings per share, diluted ............................................. $ 0.55 $ 0.85 $ 1.20 $ 0.31
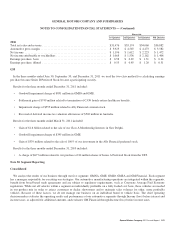
GM
In the three months ended June 30, September 30, and December 31, 2011 we used the two-class method for calculating earnings
per share because Series B Preferred Stock became a participating security.
Results for the three months ended December 31, 2011 included:
• Goodwill impairment charge of $891 million in GMIO and GME.
• Settlement gain of $749 million related to termination of CAW hourly retiree healthcare benefits.
• Impairment charge of $555 million related to Ally Financial common stock.
• Reversal of deferred income tax valuation allowances of $502 million in Australia.
Results for the three months ended March 31, 2011 included:
• Gain of $1.6 billion related to the sale of our Class A Membership Interests in New Delphi.
• Goodwill impairment charge of $395 million in GME.
• Gain of $339 million related to the sale of 100% of our investment in the Ally Financial preferred stock.
Results for the three months ended December 31, 2010 included:
• A charge of $677 million related to our purchase of 84 million shares of Series A Preferred Stock from the UST.
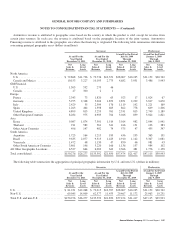
Note 30. Segment Reporting
Consolidated
We analyze the results of our business through our five segments: GMNA, GME, GMIO, GMSA and GM Financial. Each segment
has a manager responsible for executing our strategies. Our automotive manufacturing operations are integrated within the segments,
benefit from broad-based trade agreements and are subject to regulatory requirements, such as Corporate Average Fuel Economy
regulations. While not all vehicles within a segment are individually profitable on a fully loaded cost basis, those vehicles are needed
in our product mix in order to attract customers to dealer showrooms and to maintain sales volumes for other, more profitable
vehicles. Because of these factors, we do not manage our business on an individual brand or vehicle basis. The chief operating
decision maker evaluates the operating results and performance of our automotive segments through Income (loss) before interest and
income taxes, as adjusted for additional amounts, and evaluates GM Financial through Income (loss) before income taxes.
General Motors Company 2011 Annual Report 181