Philips 2006 Annual Report Download - page 118
Download and view the complete annual report
Please find page 118 of the 2006 Philips annual report below. You can navigate through the pages in the report by either clicking on the pages listed below, or by using the keyword search tool below to find specific information within the annual report.-
 1
1 -
2
-
3
-
4
-
5
-
6
-
7
-
8
-
9
-
10
-
11
-
12
-
13
-
14
-
15
-
16
-
17
-
18
-
19
-
20
-
21
-
22
-
23
-
24
-
25
-
26
-
27
-
28
-
29
-
30
-
31
-
32
-
33
-
34
-
35
-
36
-
37
-
38
-
39
-
40
-
41
-
42
-
43
-
44
-
45
-
46
-
47
-
48
-
49
-
50
-
51
-
52
-
53
-
54
-
55
-
56
-
57
-
58
-
59
-
60
-
61
-
62
-
63
-
64
-
65
-
66
-
67
-
68
-
69
-
70
-
71
-
72
-
73
-
74
-
75
-
76
-
77
-
78
-
79
-
80
-
81
-
82
-
83
-
84
-
85
-
86
-
87
-
88
-
89
-
90
-
91
-
92
-
93
-
94
-
95
-
96
-
97
-
98
-
99
-
100
-
101
-
102
-
103
-
104
-
105
-
106
-
107
-
 108
108 -
 109
109 -
 110
110 -
 111
111 -
 112
112 -
 113
113 -
 114
114 -
 115
115 -
 116
116 -
 117
117 -
 118
118 -
 119
119 -
 120
120 -
 121
121 -
 122
122 -
 123
123 -
 124
124 -
 125
125 -
 126
126 -
 127
127 -
 128
128 -
129
-
130
-
131
-
132
-
133
-
134
-
135
-
136
-
137
-
138
-
139
-
140
-
141
-
142
-
143
-
144
-
145
-
146
-
147
-
148
-
149
-
150
-
151
-
152
-
153
-
154
-
155
-
156
-
157
-
158
-
159
-
160
-
161
-
162
-
163
-
164
-
165
-
166
-
167
-
168
-
169
-
170
-
171
-
172
-
173
-
174
-
175
-
176
-
177
-
178
-
179
-
180
-
181
-
182
-
183
-
184
-
185
-
186
-
187
-
188
-
189
-
190
-
191
-
192
-
193
-
194
-
195
-
196
-
197
-
198
-
199
-
200
-
201
-
202
-
203
-
204
-
205
-
206
-
207
-
208
-
209
-
210
-
211
-
212
-
213
-
214
-
215
-
216
-
217
-
218
-
219
-
220
-
221
-
222
-
223
-
224
-
225
-
226
-
227
-
228
-
229
-
230
-
231
-
232
-
233
-
234
-
235
-
236
-
237
-
238
-
239
-
240
-
241
-
242
-
243
-
244
 |
 |

Philips Annual Report 2006118
2004 2005 2006
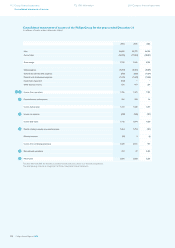
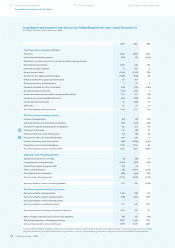
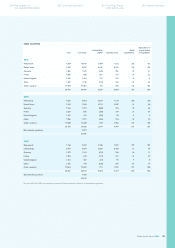
Cash fl ows from operating activities
Net income 2,836 2,868 5,383
Income from discontinued operations (252 ) (37 ) (4,464 )
Adjustments to reconcile net income to net cash provided by operating activities:
Depreciation and amortization 1,452 740 834
Impairment of equity investments 8 427 8
Net gain on sale of assets (1,304 ) (2,102 ) (289 )
(Income) loss from equity-accounted investees (1,289 ) (636 ) 228
Dividends received from equity-accounted investees 59 312 −
Minority interests (net of dividends paid) 7 15 4
Increase in receivables and other current assets (345 ) (195 ) (1,335 )
Decrease (increase) in inventories (113 ) (235 ) 2
Increase (decrease) in accounts payable, accrued and other liabilities 714 311 (33 )
Increase in non-current receivables/other assets (435 ) (250 ) (55 )
Increase (decrease) in provisions 52 (108 ) 45
Other items 45 31 14
Net cash provided by operating activities 1,435 1,141 342
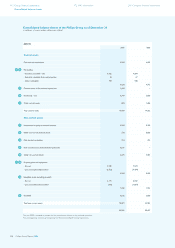
Cash fl ows from investing activities
Purchase of intangible assets (82 ) (74 ) (101 )
Capital expenditures on property, plant and equipment (673 ) (644 ) (703 )
Proceeds from disposals of property, plant and equipment 130 212 107
Cash from (to) derivatives 125 (46 ) 62
Purchase of other non-current fi nancial assets (11 ) (18 ) (31 )
Proceeds from other non-current fi nancial assets 904 630 4
Purchase of businesses, net of cash acquired (360 ) (1,089 ) (2,467 )
Proceeds from sale of interests in businesses 1,289 2,716 318
Net cash provided by (used for) investing activities 1,322 1,687 (2,811 )
Cash fl ows from fi nancing activities
(Decrease) increase in short-term debt (5 ) (36 ) 97
Principal payments on long-term debt (1,920 ) (362 ) (543 )
Proceeds from issuance of long-term debt 258 74 9
Treasury stock transactions (18 ) (1,761 ) (2,755 )
Cash dividends paid to shareholders (460 ) (504 ) (523 )
Net cash used for fi nancing activities (2,145 ) (2,589 ) (3,715 )
Net cash provided by (used for) continuing operations 612 239 (6,184 )
Cash fl ows from discontinued operations
Net cash provided by operating activities 1,348 948 512
Net cash provided by (used for) investing activities (638 ) (402 ) 6,599
Net cash provided by (used for) fi nancing activities − − −
Net cash provided by discontinued operations 710 546 7,111
Net cash provided by continuing and discontinued operations 1,322 785 927
Effect of changes in exchange rates on cash and cash equivalents (45 ) 159 (197 )
Cash and cash equivalents at the beginning of the year 3,072 4,349 5,293
Cash and cash equivalents at the end of the year 4,349 5,293 6,023
The years 2004 and 2005 are restated to present the Semiconductor division as a discontinued operation and to refl ect cash fl ows of discontinued operations in the relevant
categories, whereas they were earlier presented as a single amount on one line. The accompanying notes are an integral part of these consolidated fi nancial statements
2929
3030
Consolidated statements of cash fl ows of the Philips Group for the years ended December 31
in millions of euros unless otherwise stated
112 Group fi nancial statements
Consolidated statements of cash fl ows
172 IFRS information 218 Company fi nancial statements