Philips 2006 Annual Report Download - page 139
Download and view the complete annual report
Please find page 139 of the 2006 Philips annual report below. You can navigate through the pages in the report by either clicking on the pages listed below, or by using the keyword search tool below to find specific information within the annual report.-
 1
1 -
2
-
3
-
4
-
5
-
6
-
7
-
8
-
9
-
10
-
11
-
12
-
13
-
14
-
15
-
16
-
17
-
18
-
19
-
20
-
21
-
22
-
23
-
24
-
25
-
26
-
27
-
28
-
29
-
30
-
31
-
32
-
33
-
34
-
35
-
36
-
37
-
38
-
39
-
40
-
41
-
42
-
43
-
44
-
45
-
46
-
47
-
48
-
49
-
50
-
51
-
52
-
53
-
54
-
55
-
56
-
57
-
58
-
59
-
60
-
61
-
62
-
63
-
64
-
65
-
66
-
67
-
68
-
69
-
70
-
71
-
72
-
73
-
74
-
75
-
76
-
77
-
78
-
79
-
80
-
81
-
82
-
83
-
84
-
85
-
86
-
87
-
88
-
89
-
90
-
91
-
92
-
93
-
94
-
95
-
96
-
97
-
98
-
99
-
100
-
101
-
102
-
103
-
104
-
105
-
106
-
107
-
108
-
109
-
110
-
111
-
112
-
113
-
114
-
115
-
116
-
117
-
118
-
119
-
120
-
121
-
122
-
123
-
124
-
125
-
126
-
127
-
128
-
 129
129 -
 130
130 -
 131
131 -
 132
132 -
 133
133 -
 134
134 -
 135
135 -
 136
136 -
 137
137 -
 138
138 -
 139
139 -
 140
140 -
 141
141 -
 142
142 -
 143
143 -
 144
144 -
 145
145 -
 146
146 -
 147
147 -
 148
148 -
 149
149 -
150
-
151
-
152
-
153
-
154
-
155
-
156
-
157
-
158
-
159
-
160
-
161
-
162
-
163
-
164
-
165
-
166
-
167
-
168
-
169
-
170
-
171
-
172
-
173
-
174
-
175
-
176
-
177
-
178
-
179
-
180
-
181
-
182
-
183
-
184
-
185
-
186
-
187
-
188
-
189
-
190
-
191
-
192
-
193
-
194
-
195
-
196
-
197
-
198
-
199
-
200
-
201
-
202
-
203
-
204
-
205
-
206
-
207
-
208
-
209
-
210
-
211
-
212
-
213
-
214
-
215
-
216
-
217
-
218
-
219
-
220
-
221
-
222
-
223
-
224
-
225
-
226
-
227
-
228
-
229
-
230
-
231
-
232
-
233
-
234
-
235
-
236
-
237
-
238
-
239
-
240
-
241
-
242
-
243
-
244
 |
 |

Philips Annual Report 2006 139
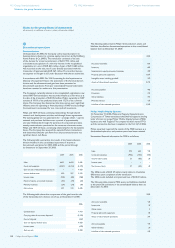
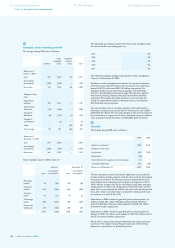
5
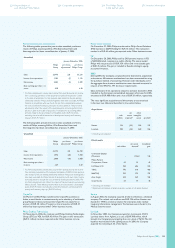
Financial income and expenses
2004 2005 2006
Interest income 48 92 156
Interest expense (306 ) (289 ) (339 )
Net interest expense (258 ) (197 ) (183 )
Income from non-current
fi nancial assets 442 240 334
Foreign exchange results (1 ) 1 2
Miscellaneous fi nancing
expense/income, net 33 64 (119 )
Total other fi nancial income
and expense 474 305 217
216 108 34
Interest income increased by EUR 64 million during 2006, mainly as
a result of higher average cash balances and higher average interest
rates applied to these cash balances during 2006, compared to 2005.
Interest expense increased by EUR 50 million during 2006, mainly as
a result of higher interest costs on derivatives related to hedging of
the Company’s foreign currency denominated cash balances and
inter-company funding positions.
In 2006, income from non-current fi nancial assets totaled EUR 334
million, and included a cash dividend of EUR 223 million from TSMC
and a gain of EUR 97 million upon designation of the TSMC shares
received through a stock dividend as trading securities. In 2005, EUR
233 million of tax-exempt gains from the sale of the remaining shares
in Atos Origin and Great Nordic were recognized. In 2004, EUR 440
million of tax-exempt gains on the sale of the remaining shares in
ASML and Vivendi Universal were recorded.
In 2006, miscellaneous fi nancial charges included an impairment charge
of EUR 77 million in relation to the investment in TPO Display Corp,
a further EUR 61 million loss as a result of the fair value change in the
conversion option embedded in the convertible bond received from
TPV and a EUR 29 million gain as a result of increases in the fair value
of the trading securities held in TSMC. In 2005, miscellaneous fi nancial
charges included a EUR 53 million fair value gain on the conversion
option embedded in the TPV convertible bond.
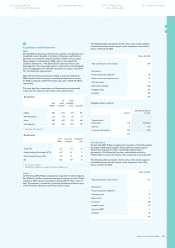
6
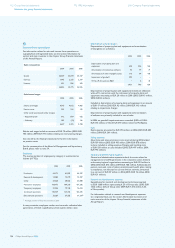
Income taxes
The tax expense on income before tax amounted to EUR 137 million
in 2006 (2005: EUR 506 million, 2004: EUR 230 million). TSMC shares
held by Philips in Taiwan were transferred to Philips in the Netherlands
in 2005. This resulted in a withholding tax expense of EUR 240
million in 2005.
55
66
The components of income before taxes are as follows:
2004 2005 2006
Netherlands 856 616 444
Foreign 516 964 773
Income before taxes 1,372 1,580 1,217
Netherlands:
Current taxes (46 ) 3 81
Deferred taxes (100 ) (92 ) (58 )
(146 ) (89 ) 23
Foreign:
Current taxes (220 ) (454 ) (273 )
Deferred taxes 136 37 113
(84 ) (417 ) (160 )
Income tax expense (230 ) (506 ) (137 )
Philips’ operations are subject to income taxes in various foreign
jurisdictions. The statutory income tax rates vary from 12.5% to
41.0%, which causes a difference between the weighted average
statutory income tax rate and the Netherlands’ statutory income
tax rate of 29.6% (2005: 31.5%; 2004: 34.5%).
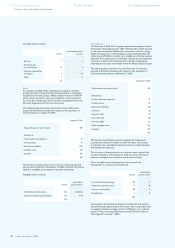
A reconciliation of the weighted average statutory income tax rate
to the effective income tax rate is as follows:
2004 2005 2006
Weighted average statutory
income tax rate 34.9 32.6 30.1
Tax effect of:
Changes in the valuation allowance:
utilization of previously reserved loss
carryforwards
-
(1.3 ) (3.2 ) (1.6 )
new loss carryforwards not expected
to be realized
-
2.8 3.1 2.2
addition/(releases) - (4.6 ) (9.3 ) 3.5
Non-tax-deductible impairment charges 14.8 − −
Non-taxable income (33.3 ) (10.0 ) (16.3 )
Non-tax-deductible expenses 2.6 4.9 9.0
Withholding and other taxes 1.0 16.3 1.2
Tax incentives and other (0.1 ) (2.4 ) (16.8 )
Effective tax rate 16.8 32.0 11.3
The weighted average statutory tax rate declined due to changes in
tax rates in certain countries, primarily due to a decrease in the tax
rate in the Netherlands refl ected in Tax incentives and other.
Non-taxable income mainly relates to TSMC dividend.
226 Corporate governance224 Reconciliation of
non-US GAAP information
234 The Philips Group
in the last ten years
236 Investor information