Philips 2006 Annual Report Download - page 224
Download and view the complete annual report
Please find page 224 of the 2006 Philips annual report below. You can navigate through the pages in the report by either clicking on the pages listed below, or by using the keyword search tool below to find specific information within the annual report.-
 1
1 -
2
-
3
-
4
-
5
-
6
-
7
-
8
-
9
-
10
-
11
-
12
-
13
-
14
-
15
-
16
-
17
-
18
-
19
-
20
-
21
-
22
-
23
-
24
-
25
-
26
-
27
-
28
-
29
-
30
-
31
-
32
-
33
-
34
-
35
-
36
-
37
-
38
-
39
-
40
-
41
-
42
-
43
-
44
-
45
-
46
-
47
-
48
-
49
-
50
-
51
-
52
-
53
-
54
-
55
-
56
-
57
-
58
-
59
-
60
-
61
-
62
-
63
-
64
-
65
-
66
-
67
-
68
-
69
-
70
-
71
-
72
-
73
-
74
-
75
-
76
-
77
-
78
-
79
-
80
-
81
-
82
-
83
-
84
-
85
-
86
-
87
-
88
-
89
-
90
-
91
-
92
-
93
-
94
-
95
-
96
-
97
-
98
-
99
-
100
-
101
-
102
-
103
-
104
-
105
-
106
-
107
-
108
-
109
-
110
-
111
-
112
-
113
-
114
-
115
-
116
-
117
-
118
-
119
-
120
-
121
-
122
-
123
-
124
-
125
-
126
-
127
-
128
-
129
-
130
-
131
-
132
-
133
-
134
-
135
-
136
-
137
-
138
-
139
-
140
-
141
-
142
-
143
-
144
-
145
-
146
-
147
-
148
-
149
-
150
-
151
-
152
-
153
-
154
-
155
-
156
-
157
-
158
-
159
-
160
-
161
-
162
-
163
-
164
-
165
-
166
-
167
-
168
-
169
-
170
-
171
-
172
-
173
-
174
-
175
-
176
-
177
-
178
-
179
-
180
-
181
-
182
-
183
-
184
-
185
-
186
-
187
-
188
-
189
-
190
-
191
-
192
-
193
-
194
-
195
-
196
-
197
-
198
-
199
-
200
-
201
-
202
-
203
-
204
-
205
-
206
-
207
-
208
-
209
-
210
-
211
-
212
-
213
-
 214
214 -
 215
215 -
 216
216 -
 217
217 -
 218
218 -
 219
219 -
 220
220 -
 221
221 -
 222
222 -
 223
223 -
 224
224 -
 225
225 -
 226
226 -
 227
227 -
 228
228 -
 229
229 -
 230
230 -
 231
231 -
 232
232 -
 233
233 -
 234
234 -
235
-
236
-
237
-
238
-
239
-
240
-
241
-
242
-
243
-
244
 |
 |

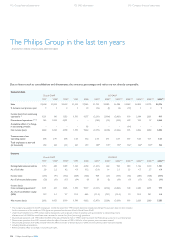
Philips Annual Report 2006224
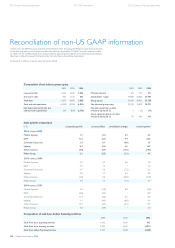
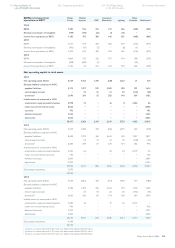
Certain non-US GAAP fi nancial measures are presented when discussing the Philips Group’s fi nancial position.
In the following tables, a reconciliation to the most directly comparable US GAAP fi nancial measure is made
for each non-US GAAP performance measure. Where appropriate the fi gures in the following reconciliations
have been restated to present the Semiconductors activities as discontinued operations.
All amounts in millions of euros unless otherwise stated.
Composition of net debt to group equity
2004 2005 2006 2004 2005 2006
Long-term debt 3,552 3,320 3,006 Minority interests 159 159 131
Short-term debt 961 1,167 863 Stockholders’ equity 14,860 16,666 22,997
Total debt 4,513 4,487 3,869 Group equity 15,019 16,825 23,128
Cash and cash equivalents (4,349 ) (5,293 ) (6,023 ) Net debt and group equity 15,183 16,019 20,974
Net debt (cash) (total debt less
cash and cash equivalents) 164 (806 ) (2,154 )
Net debt divided by net debt
and group equity (in %) 1 (5 ) (10 )
Group equity divided by net debt
and group equity (in %) 99 105 110
Reconciliation of non-US GAAP information
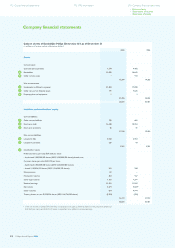
112 Group fi nancial statements 172 IFRS information 218 Company fi nancial statements
Sales growth composition
in % comparable growth currency effects consolidation changes nominal growth
2006 versus 2005
Medical Systems 7.3 (1.1 ) 0.1 6.3
DAP 11.2 (0.1 ) 9.4 20.5
Consumer Electronics 5.4 0.1 (4.0 ) 1.5
Lighting 8.3 (0.3 ) 6.5 14.5
Other Activities (6.8 ) (0.4 ) (17.0 ) (24.2 )
Philips Group 6.1 (0.3 ) (1.1 ) 4.7
2005 versus 2004
Medical Systems 6.7 0.5 0.6 7.8
DAP 5.9 1.5 − 7.4
Consumer Electronics 4.7 1.6 (1.2 ) 5.1
Lighting 4.0 1.1 0.4 5.5
Other Activities (5.2 ) 0.2 (12.8 ) (17.8 )
Philips Group 4.3 1.1 (1.7 ) 3.7
2004 versus 2003
Medical Systems 3.9 (5.9 ) 0.2 (1.8 )
DAP (0.6 ) (3.5 ) − (4.1 )
Consumer Electronics 11.3 (4.0 ) 0.7 8.0
Lighting 5.1 (4.2 ) (0.8 ) 0.1
Other Activities 17.7 (3.7 ) (2.1 ) 11.9
Philips Group 7.8 (4.4 ) − 3.4
Composition of cash fl ows before fi nancing activities
2004 2005 2006
Cash fl ows from operating activities 1,435 1,141 342
Cash fl ows from investing activities 1,322 1,687 (2,811 )
Cash fl ows before fi nancing activities 2,757 2,828 (2,469 )