Philips 2006 Annual Report Download - page 76
Download and view the complete annual report
Please find page 76 of the 2006 Philips annual report below. You can navigate through the pages in the report by either clicking on the pages listed below, or by using the keyword search tool below to find specific information within the annual report.-
 1
1 -
2
-
3
-
4
-
5
-
6
-
7
-
8
-
9
-
10
-
11
-
12
-
13
-
14
-
15
-
16
-
17
-
18
-
19
-
20
-
21
-
22
-
23
-
24
-
25
-
26
-
27
-
28
-
29
-
30
-
31
-
32
-
33
-
34
-
35
-
36
-
37
-
38
-
39
-
40
-
41
-
42
-
43
-
44
-
45
-
46
-
47
-
48
-
49
-
50
-
51
-
52
-
53
-
54
-
55
-
56
-
57
-
58
-
59
-
60
-
61
-
62
-
63
-
64
-
65
-
 66
66 -
 67
67 -
 68
68 -
 69
69 -
 70
70 -
 71
71 -
 72
72 -
 73
73 -
 74
74 -
 75
75 -
 76
76 -
 77
77 -
 78
78 -
 79
79 -
 80
80 -
 81
81 -
 82
82 -
 83
83 -
 84
84 -
 85
85 -
 86
86 -
87
-
88
-
89
-
90
-
91
-
92
-
93
-
94
-
95
-
96
-
97
-
98
-
99
-
100
-
101
-
102
-
103
-
104
-
105
-
106
-
107
-
108
-
109
-
110
-
111
-
112
-
113
-
114
-
115
-
116
-
117
-
118
-
119
-
120
-
121
-
122
-
123
-
124
-
125
-
126
-
127
-
128
-
129
-
130
-
131
-
132
-
133
-
134
-
135
-
136
-
137
-
138
-
139
-
140
-
141
-
142
-
143
-
144
-
145
-
146
-
147
-
148
-
149
-
150
-
151
-
152
-
153
-
154
-
155
-
156
-
157
-
158
-
159
-
160
-
161
-
162
-
163
-
164
-
165
-
166
-
167
-
168
-
169
-
170
-
171
-
172
-
173
-
174
-
175
-
176
-
177
-
178
-
179
-
180
-
181
-
182
-
183
-
184
-
185
-
186
-
187
-
188
-
189
-
190
-
191
-
192
-
193
-
194
-
195
-
196
-
197
-
198
-
199
-
200
-
201
-
202
-
203
-
204
-
205
-
206
-
207
-
208
-
209
-
210
-
211
-
212
-
213
-
214
-
215
-
216
-
217
-
218
-
219
-
220
-
221
-
222
-
223
-
224
-
225
-
226
-
227
-
228
-
229
-
230
-
231
-
232
-
233
-
234
-
235
-
236
-
237
-
238
-
239
-
240
-
241
-
242
-
243
-
244
 |
 |

Philips Annual Report 200676
Key data
in millions of euros
20031) 20041) 2005
Sales 2,218 2,482 2,041
Sales growth
% increase (decrease), nominal
% increase (decrease), comparable
(25
(5
)
)
12
18
(18
(5
)
)
EBIT Corporate Technologies (293) (323) (219)
EBIT Corporate Investments (63) 35 (62)
EBIT Other 93 654 125
Total earnings before interest and tax
as a % of sales
(263
(11.9
)
)
366
14.7
(156
(7.6
)
)
Net operating capital (NOC) 150 117 272
Cash fl ows before fi nancing activities
(769) 741 2,584
Employees 27,086 23,869 19,050
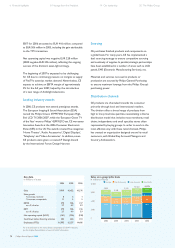
Key data
in millions of euros
2004 2005 2006
Sales 4,526 4,775 5,466
Sales growth
% increase, nominal 0 6 14
% increase, comparable 5 4 8
EBITA 594 564 666
as a % of sales 13.1 11.8 12.2
EBIT 593 556 635
as a % of sales 13.1 11.6 11.6
Net operating capital (NOC) 1,493 2,491 2,527
Cash fl ows before fi nancing activities
625 (180) 509
Employees (FTEs) 44,004 45,649 47,739
For a reconciliation to the most directly comparable US GAAP measures,
see the chapter Reconciliation of non-US GAAP information
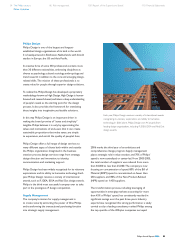
Lamps achieved a further increase in comparable sales
growth. Lumileds – with sales amounting to EUR 328
million – exceeded its expected 25% growth for the full
year. All regions recorded higher comparable sales, led
by Eastern Europe and Asia Pacifi c.
Full-year EBIT amounted to EUR 635 million, an increase
of EUR 79 million compared to 2005. The EBIT improvement
was primarily attributable to the profi table growth in
Lamps and Luminaires. Lumileds reported a positive EBIT
in 2006, despite EUR 43 million acquisition-related charges.
Restructuring and impairment charges amounted to EUR
48 million in 2006, compared to EUR 41 million in 2005.
Cash fl ows before fi nancing activities, allowing for the
EUR 788 million cash outfl ow for the Lumileds acquisition
in 2005, declined from EUR 608 million in 2005 to a cash
fl ow of EUR 509 million in 2006. The increase in net
capital expenditures – mainly related to investments in
Lumileds – and the acquisition of Bodine were partly
offset by improved cash fl ows from operating activities.
Net inventories declined from 14.9% of sales in 2005
to 13.4% in 2006, largely driven by improved supply
chain management at Lamps and Luminaires.
Lighting will consolidate Partners in Lighting International
in the fi rst quarter of 2007. The launch of innovative
products and a focus on emerging markets in 2007 will
help the division achieve an EBITA margin of around 12%.
Leading industry awards
Lighting won several major industry awards in 2006.
These included a Gold iF design award for the Philips
Pedestrian LED Luminaire. Automotive Lighting in North
America won the Frost & Sullivan product-line strategy
award, while Philips Lighting was designated ‘Supplier of
the Year’ by AD (Affi liated Distributors), the largest
electrical marketing organization in the US.
Sourcing
Lighting utilizes a global supply base to support its varied
manufacturing operations. An increasing focus on supply
from low-cost countries has maintained a high level
of competitive pressure across the entire supply base.
In China, Lighting has a dedicated China Sourcing Group
to source products for both local and export markets
from its eight factories and local suppliers.
To reduce sourcing risk, Lighting has established partnership
agreements with those key suppliers on which it depends
for the supply of critical lamp components. Commodity
products, on the other hand, are sourced through
divisional or Philips Group-wide commodity teams to
maximize leverage. For non-product-related expenditures,
Lighting again takes advantage of Group-wide general
purchasing contracts. As well as price and quality,
sustainability is a key consideration in the sourcing
decision process. Assessments and audits in high-risk
areas are performed on a continuous basis to ensure
compliance with Philips requirements.
Philips Annual Report 200676
Sales on a geographic basis
in millions of euros
Europe North America LatinAmerica Asia Pacific
6,000
5,000
4,000
3,000
2,000
1,000
0
2,128
1,242
411
1,064
2002
4,845
2,065
1,098
328
1,031
2003
4,522
2,110
1,051
322
1,043
2004
4,526
2,226
1,057
360
1,132
2005
4,775
2,496
1,194
388
1,388
2006
5,466
6 Financial highlights 8 Message from the President 14 Our leadership 20 The Philips Group