Philips 2006 Annual Report Download - page 178
Download and view the complete annual report
Please find page 178 of the 2006 Philips annual report below. You can navigate through the pages in the report by either clicking on the pages listed below, or by using the keyword search tool below to find specific information within the annual report.-
 1
1 -
2
-
3
-
4
-
5
-
6
-
7
-
8
-
9
-
10
-
11
-
12
-
13
-
14
-
15
-
16
-
17
-
18
-
19
-
20
-
21
-
22
-
23
-
24
-
25
-
26
-
27
-
28
-
29
-
30
-
31
-
32
-
33
-
34
-
35
-
36
-
37
-
38
-
39
-
40
-
41
-
42
-
43
-
44
-
45
-
46
-
47
-
48
-
49
-
50
-
51
-
52
-
53
-
54
-
55
-
56
-
57
-
58
-
59
-
60
-
61
-
62
-
63
-
64
-
65
-
66
-
67
-
68
-
69
-
70
-
71
-
72
-
73
-
74
-
75
-
76
-
77
-
78
-
79
-
80
-
81
-
82
-
83
-
84
-
85
-
86
-
87
-
88
-
89
-
90
-
91
-
92
-
93
-
94
-
95
-
96
-
97
-
98
-
99
-
100
-
101
-
102
-
103
-
104
-
105
-
106
-
107
-
108
-
109
-
110
-
111
-
112
-
113
-
114
-
115
-
116
-
117
-
118
-
119
-
120
-
121
-
122
-
123
-
124
-
125
-
126
-
127
-
128
-
129
-
130
-
131
-
132
-
133
-
134
-
135
-
136
-
137
-
138
-
139
-
140
-
141
-
142
-
143
-
144
-
145
-
146
-
147
-
148
-
149
-
150
-
151
-
152
-
153
-
154
-
155
-
156
-
157
-
158
-
159
-
160
-
161
-
162
-
163
-
164
-
165
-
166
-
167
-
 168
168 -
 169
169 -
 170
170 -
 171
171 -
 172
172 -
 173
173 -
 174
174 -
 175
175 -
 176
176 -
 177
177 -
 178
178 -
 179
179 -
 180
180 -
 181
181 -
 182
182 -
 183
183 -
 184
184 -
 185
185 -
 186
186 -
 187
187 -
 188
188 -
189
-
190
-
191
-
192
-
193
-
194
-
195
-
196
-
197
-
198
-
199
-
200
-
201
-
202
-
203
-
204
-
205
-
206
-
207
-
208
-
209
-
210
-
211
-
212
-
213
-
214
-
215
-
216
-
217
-
218
-
219
-
220
-
221
-
222
-
223
-
224
-
225
-
226
-
227
-
228
-
229
-
230
-
231
-
232
-
233
-
234
-
235
-
236
-
237
-
238
-
239
-
240
-
241
-
242
-
243
-
244
 |
 |

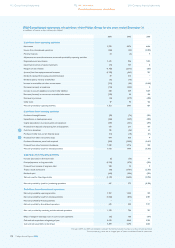
Philips Annual Report 2006178
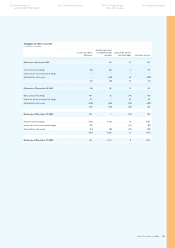
2004 2005 2006
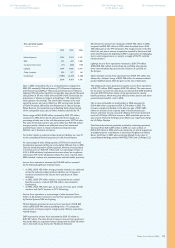
Cash fl ows from operating activities
Net income 2,783 3,374 4,664
Income from discontinued operations (353 ) (42 ) (3,992 )
Minority interests 24 (2 ) 4
Adjustments to reconcile net income to net cash provided by operating activities:
Depreciation and amortization 1,615 946 1,014
Impairment (reversal) of equity investments (11 ) 137 8
Net gain on sale of assets (1,163 ) (2,313 ) (232 )
(Income) loss from equity-accounted investees (1,278 ) (661 ) 237
Dividends received from equity-accounted investees 59 312 −
Dividends paid to minority shareholders (16 ) (16 ) −
Increase in receivables and other current assets (313 ) (39 ) (2,048 )
Decrease (increase) in inventories (113 ) (235 ) 2
Increase in accounts payable, accrued and other liabilities 688 259 1,029
Decrease (increase) in non-current receivables/other assets (233 ) 98 138
Decrease in provisions (13 ) (417 ) (305
)
Other items 47 40 132
Net cash provided by operating activities 1,723 1,441 651
Cash fl ows from investing activities
Purchase of intangible assets (82 ) (74 ) (101 )
Expenditures on development assets (233 ) (259 ) (295 )
Capital expenditures on property, plant and equipment (669 ) (631 ) (707 )
Proceeds from disposals of property, plant and equipment 130 211 107
Cash from derivatives 125 (46 ) 62
Purchase of other non-current fi nancial assets (11 ) (18 ) (31 )
Proceeds from other non-current assets 904 630 4
Purchase of businesses, net of cash acquired (360 ) (1,089 ) (2,467 )
Proceeds from sale of interests in businesses 1,289 2,716 318
Net cash provided by (used for) investing activities 1,093 1,440 (3,110 )
Cash fl ows from fi nancing activities
Increase (decrease) in short-term debt (5 ) (36 ) 97
Principal payments on long-term debt (1,924 ) (375 ) (553 )
Proceeds from issuance of long-term debt 258 74 9
Treasury stock transactions (18 ) (1,761 ) (2,755 )
Dividends paid (460 ) (504 ) (523 )
Net cash used for fi nancing activities (2,149 ) (2,602 ) (3,725 )
Net cash provided by (used for) continuing operations 667 279 (6,184 )
Cash fl ows from discontinued operations
Net cash provided by operating activities 1,707 1,345 570
Net cash provided by (used for) investing activities (1,052 ) (840 ) 6,541
Net cash provided by fi nancing activities − − −
Net cash provided by discontinued operations 655 505 7,111
Net cash provided by continuing and discontinued operations 1,322 784 927
Effect of changes in exchange rates on cash and cash equivalents (45 ) 160 (197 )
Cash and cash equivalents at beginning of year 3,072 4,349 5,293
Cash and cash equivalents at end of year 4,349 5,293 6,023
The years 2004 and 2005 are restated to present the Semiconductors business as a discontinued operation.
The accompanying notes are an integral part of these consolidated fi nancial statements.
2929
3030
IFRS Consolidated statements of cash fl ows of the Philips Group for the years ended December 31
in millions of euros unless otherwise stated
112 Group fi nancial statements 172 IFRS information
Consolidated statements of cash fl ows
218 Company fi nancial statements