Philips 2006 Annual Report Download - page 33
Download and view the complete annual report
Please find page 33 of the 2006 Philips annual report below. You can navigate through the pages in the report by either clicking on the pages listed below, or by using the keyword search tool below to find specific information within the annual report.-
 1
1 -
2
-
3
-
4
-
5
-
6
-
7
-
8
-
9
-
10
-
11
-
12
-
13
-
14
-
15
-
16
-
17
-
18
-
19
-
20
-
21
-
22
-
 23
23 -
 24
24 -
 25
25 -
 26
26 -
 27
27 -
 28
28 -
 29
29 -
 30
30 -
 31
31 -
 32
32 -
 33
33 -
 34
34 -
 35
35 -
 36
36 -
 37
37 -
 38
38 -
 39
39 -
 40
40 -
 41
41 -
 42
42 -
 43
43 -
44
-
45
-
46
-
47
-
48
-
49
-
50
-
51
-
52
-
53
-
54
-
55
-
56
-
57
-
58
-
59
-
60
-
61
-
62
-
63
-
64
-
65
-
66
-
67
-
68
-
69
-
70
-
71
-
72
-
73
-
74
-
75
-
76
-
77
-
78
-
79
-
80
-
81
-
82
-
83
-
84
-
85
-
86
-
87
-
88
-
89
-
90
-
91
-
92
-
93
-
94
-
95
-
96
-
97
-
98
-
99
-
100
-
101
-
102
-
103
-
104
-
105
-
106
-
107
-
108
-
109
-
110
-
111
-
112
-
113
-
114
-
115
-
116
-
117
-
118
-
119
-
120
-
121
-
122
-
123
-
124
-
125
-
126
-
127
-
128
-
129
-
130
-
131
-
132
-
133
-
134
-
135
-
136
-
137
-
138
-
139
-
140
-
141
-
142
-
143
-
144
-
145
-
146
-
147
-
148
-
149
-
150
-
151
-
152
-
153
-
154
-
155
-
156
-
157
-
158
-
159
-
160
-
161
-
162
-
163
-
164
-
165
-
166
-
167
-
168
-
169
-
170
-
171
-
172
-
173
-
174
-
175
-
176
-
177
-
178
-
179
-
180
-
181
-
182
-
183
-
184
-
185
-
186
-
187
-
188
-
189
-
190
-
191
-
192
-
193
-
194
-
195
-
196
-
197
-
198
-
199
-
200
-
201
-
202
-
203
-
204
-
205
-
206
-
207
-
208
-
209
-
210
-
211
-
212
-
213
-
214
-
215
-
216
-
217
-
218
-
219
-
220
-
221
-
222
-
223
-
224
-
225
-
226
-
227
-
228
-
229
-
230
-
231
-
232
-
233
-
234
-
235
-
236
-
237
-
238
-
239
-
240
-
241
-
242
-
243
-
244
 |
 |

Philips Annual Report 2006 33
in 2005, a EUR 170 million release of a postretirement
medical benefi ts provision, of which EUR 116 million
was included in Unallocated;
in 2005, a EUR 136 million gain on the sale of certain
parts of CE’s monitors and FlatTV business to TPV
Technology.
EBIT as a percentage of sales decreased from 5.7% to 4.4%,
despite EBIT increases achieved by Medical Systems,
DAP
and Lighting.
Medical Systems generated EBIT of EUR 795 million
(2005: EUR 679 million), benefi ting from 7% comparable
sales growth and improved gross margins, partly offset
by acquisition-related charges.
DAP improved its EBIT by EUR 28 million to EUR 386
million. The sales-driven EBIT increase was partly offset
by acquisition-related charges and a EUR 18 million loss
in the newly set-up Consumer Healthcare Solutions.
CE achieved EBIT of EUR 416 million in 2006, compared
to EUR 506 million in 2005, which benefi ted from a
EUR 136 million gain on the TPV transaction. The severe
margin erosion in the fi rst half of 2006, due to intense
competition, eased off in the second half of the year.
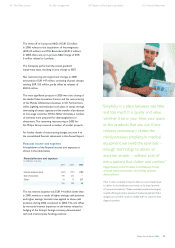
However, the beginning of 2007 is expected to be
challenging, due to continuing pressure on margins
as supply of FlatTV outstrips market demand.
Lighting’s EBIT increased to EUR 635 million (2005:
EUR 556 million), mainly driven by profi table sales
growth, lower non-manufacturing costs and the
inclusion of Lumileds
for the full year.
Other Activities’ EBIT loss of EUR 448 million was
affected by the aforementioned EUR 256 million charge
for asbestos-related product liabilities, partly offset by
gains on the sale of businesses.
The Unallocated sector generated a negative EBIT
of EUR 601 million (2005: negative EUR 471 million).
The main reason for the lower EBIT was the fact that
2005 benefi ted from a EUR 116 million release of the
postretirement medical benefi ts provision, which was
partly offset by lower pension and other postretirement
benefi ts costs in 2006.
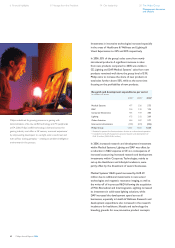
Net income in 2006 amounted to EUR 5,383 million
compared to EUR 2,868 million in 2005. The increase
is largely attributable to the after-tax gain of EUR 4,283
•
•
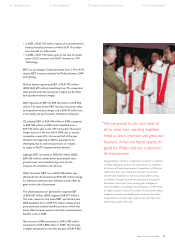
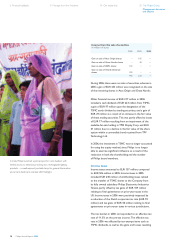
“We are proud to win, but most of
all, to show how working together
helps us learn, improve and grow our
business. When we boost quality, it’s
good for Philips and our customers.”
Yujin Zheng, project leader
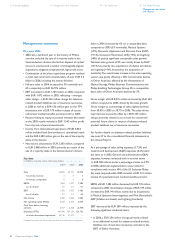
Engaged talent is vital for an organization’s success. The workforce
of Philips Lighting has a passion for improvement, as evidenced
by the annual Quality Improvement Competition. In 2006, over
2,600 teams from across the globe took part. The winners
showed what dedication to teamwork and problem-solving
can achieve. Through improved manufacturing and inspection
techniques, a team from China, working with colleagues in
Turnhout, Belgium, cut wastage in the production of UHP lamps
for digital projection systems. The number of loose burner defects
dropped to virtually zero, delighting key customer Sony, which
recognized this consistent high quality by naming Philips ‘best-
performing supplier of the year’.
54 The Philips sectors 86 Risk management 100 Report of the Supervisory Board 110 Financial Statements