Philips 2006 Annual Report Download - page 96
Download and view the complete annual report
Please find page 96 of the 2006 Philips annual report below. You can navigate through the pages in the report by either clicking on the pages listed below, or by using the keyword search tool below to find specific information within the annual report.-
 1
1 -
2
-
3
-
4
-
5
-
6
-
7
-
8
-
9
-
10
-
11
-
12
-
13
-
14
-
15
-
16
-
17
-
18
-
19
-
20
-
21
-
22
-
23
-
24
-
25
-
26
-
27
-
28
-
29
-
30
-
31
-
32
-
33
-
34
-
35
-
36
-
37
-
38
-
39
-
40
-
41
-
42
-
43
-
44
-
45
-
46
-
47
-
48
-
49
-
50
-
51
-
52
-
53
-
54
-
55
-
56
-
57
-
58
-
59
-
60
-
61
-
62
-
63
-
64
-
65
-
66
-
67
-
68
-
69
-
70
-
71
-
72
-
73
-
74
-
75
-
76
-
77
-
78
-
79
-
80
-
81
-
82
-
83
-
84
-
85
-
 86
86 -
 87
87 -
 88
88 -
 89
89 -
 90
90 -
 91
91 -
 92
92 -
 93
93 -
 94
94 -
 95
95 -
 96
96 -
 97
97 -
 98
98 -
 99
99 -
 100
100 -
 101
101 -
 102
102 -
 103
103 -
 104
104 -
 105
105 -
 106
106 -
107
-
108
-
109
-
110
-
111
-
112
-
113
-
114
-
115
-
116
-
117
-
118
-
119
-
120
-
121
-
122
-
123
-
124
-
125
-
126
-
127
-
128
-
129
-
130
-
131
-
132
-
133
-
134
-
135
-
136
-
137
-
138
-
139
-
140
-
141
-
142
-
143
-
144
-
145
-
146
-
147
-
148
-
149
-
150
-
151
-
152
-
153
-
154
-
155
-
156
-
157
-
158
-
159
-
160
-
161
-
162
-
163
-
164
-
165
-
166
-
167
-
168
-
169
-
170
-
171
-
172
-
173
-
174
-
175
-
176
-
177
-
178
-
179
-
180
-
181
-
182
-
183
-
184
-
185
-
186
-
187
-
188
-
189
-
190
-
191
-
192
-
193
-
194
-
195
-
196
-
197
-
198
-
199
-
200
-
201
-
202
-
203
-
204
-
205
-
206
-
207
-
208
-
209
-
210
-
211
-
212
-
213
-
214
-
215
-
216
-
217
-
218
-
219
-
220
-
221
-
222
-
223
-
224
-
225
-
226
-
227
-
228
-
229
-
230
-
231
-
232
-
233
-
234
-
235
-
236
-
237
-
238
-
239
-
240
-
241
-
242
-
243
-
244
 |
 |

Philips Annual Report 200696
guarantees (unless country risk is explicitly excluded in
the guarantee), accounts receivable from third parties
and intercompany accounts receivable. The country
risk is monitored on a regular basis.
As of December 31, 2006 the Company had country risk
exposure exceeding EUR 1 billion in each of the following
countries: Belgium, China (including Hong Kong), South
Korea, Taiwan, the Netherlands and the United States.
Countries where the risk exceeded EUR 200 million
included Austria, France, Germany, Italy, Poland and
the United Kingdom.
The degree of risk of a country is taken into account
when new investments are considered. The Company
does not, however, use fi nancial derivative instruments
to hedge country risk.
Other insurable risks
Philips is covered for a range of different kinds of losses by
global insurance policies in the areas of property damage,
business interruption, general and products liability, transport,
directors and offi cers liability, employment practice liability,
criminal liability, and aviation products liability.
To lower exposures and to avoid potential losses,
Philips has a worldwide Risk Engineering program in
place. The main focus in this program is on property
damage and business interruption risks, which also
include interdependencies. Philips’ sites and also
a limited number of sites of key suppliers, are inspected
on a regular basis by the Risk Engineering personnel of
the insurer. Inspections are carried out against predefi ned
Risk Engineering standards which are agreed between
Philips and the insurers. Recommendations are made in
a Risk Management report and are reviewed centrally.
This is the basis for decision-making by the local
management of the business as to which recommendations
will be implemented. For all policies, deductibles are in
place which vary from EUR 45,000 to EUR 500,000 per
occurrence and this variance is designed to differentiate
between the existing risk categories within Philips. Above
this fi rst layer of working deductibles, Philips operates its
own re-insurance captive, which during 2006 retained
EUR 10 million per occurrence for the property damage
and business interruption losses and EUR 30 million in
the aggregate per year. For general and product liability
claims the captive will retain EUR 1.5 million per claim
and EUR 5 million in the aggregate. New contracts were
signed on December 31, 2006 for the coming year whereby
the re-insurance captive will retain EUR 2.5 million per
occurrence for the property damage and business
interruption losses and EUR 5 million in the aggregate
per year. For general and product liability claims the
captive will retain EUR 1.5 million per claim and
EUR 6 million in the aggregate.
Fair value measurement
The company calculates the fair value of derivatives and
sensitivities based on observed liquid market quotations.
Where the instrument is not directly observable the
valuation techniques used are qualifi ed and benchmarked
regularly with industry. Values are based on market
quotations. Given the large liquidity of the derivative
instruments used, the unwind prices are not signifi cantly
different from the quoted fi gures.
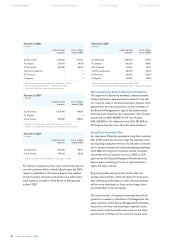
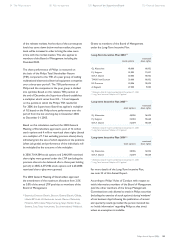
Pensions
This section further analyzes the pension exposure
and possible risks thereof.
Pension-related exposure to changes in fi nancial markets
With pension obligations in more than 40 countries,
Philips has devoted considerable attention and resources
to ensuring disclosure, awareness and control of the
resulting exposures.
Depending on the investment policies of the respective
pension funds, developments in fi nancial markets may
have a signifi cant effect on the funded status and the net
periodic pension cost (NPPC) of Philips’ pension plans.
To monitor this exposure to investment risk, Philips uses
a ‘Global Risk Reward Model’. The model, which covers
approximately 95% of Philips’ total pension liabilities and
contains separate modules for the Netherlands, the UK,
the US and Germany, allows stochastic simulations of
Philips’ pension accounting fi gures.
The dispersion of the outcomes of these simulations
around their average (or expected) values provides an
indication of Philips’ risk exposure. The bar charts below
show the maximum deviations from the expected funded
status as per year-end 2006 and year-end 2007 and the
expected NPPC for 2007 and 2008 respectively, if the 5%
worst possible outcomes are excluded. These “funded-
status-at-risk” and “NPPC-at-risk” measures are based
on the plan assets and liabilities and the bond and equity
market valuations on December 31, 2005 and December
31, 2006 respectively, and may therefore be seen as indicators
of the funding and NPPC risks on these same dates.
6 Financial highlights 8 Message from the President 14 Our leadership 20 The Philips Group