Philips 2006 Annual Report Download - page 156
Download and view the complete annual report
Please find page 156 of the 2006 Philips annual report below. You can navigate through the pages in the report by either clicking on the pages listed below, or by using the keyword search tool below to find specific information within the annual report.-
 1
1 -
2
-
3
-
4
-
5
-
6
-
7
-
8
-
9
-
10
-
11
-
12
-
13
-
14
-
15
-
16
-
17
-
18
-
19
-
20
-
21
-
22
-
23
-
24
-
25
-
26
-
27
-
28
-
29
-
30
-
31
-
32
-
33
-
34
-
35
-
36
-
37
-
38
-
39
-
40
-
41
-
42
-
43
-
44
-
45
-
46
-
47
-
48
-
49
-
50
-
51
-
52
-
53
-
54
-
55
-
56
-
57
-
58
-
59
-
60
-
61
-
62
-
63
-
64
-
65
-
66
-
67
-
68
-
69
-
70
-
71
-
72
-
73
-
74
-
75
-
76
-
77
-
78
-
79
-
80
-
81
-
82
-
83
-
84
-
85
-
86
-
87
-
88
-
89
-
90
-
91
-
92
-
93
-
94
-
95
-
96
-
97
-
98
-
99
-
100
-
101
-
102
-
103
-
104
-
105
-
106
-
107
-
108
-
109
-
110
-
111
-
112
-
113
-
114
-
115
-
116
-
117
-
118
-
119
-
120
-
121
-
122
-
123
-
124
-
125
-
126
-
127
-
128
-
129
-
130
-
131
-
132
-
133
-
134
-
135
-
136
-
137
-
138
-
139
-
140
-
141
-
142
-
143
-
144
-
145
-
 146
146 -
 147
147 -
 148
148 -
 149
149 -
 150
150 -
 151
151 -
 152
152 -
 153
153 -
 154
154 -
 155
155 -
 156
156 -
 157
157 -
 158
158 -
 159
159 -
 160
160 -
 161
161 -
 162
162 -
 163
163 -
 164
164 -
 165
165 -
 166
166 -
167
-
168
-
169
-
170
-
171
-
172
-
173
-
174
-
175
-
176
-
177
-
178
-
179
-
180
-
181
-
182
-
183
-
184
-
185
-
186
-
187
-
188
-
189
-
190
-
191
-
192
-
193
-
194
-
195
-
196
-
197
-
198
-
199
-
200
-
201
-
202
-
203
-
204
-
205
-
206
-
207
-
208
-
209
-
210
-
211
-
212
-
213
-
214
-
215
-
216
-
217
-
218
-
219
-
220
-
221
-
222
-
223
-
224
-
225
-
226
-
227
-
228
-
229
-
230
-
231
-
232
-
233
-
234
-
235
-
236
-
237
-
238
-
239
-
240
-
241
-
242
-
243
-
244
 |
 |

Philips Annual Report 2006156
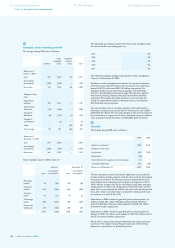
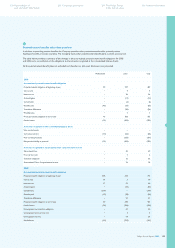
24
Long-term debt
range of
interest rates
average rate
of interest
amount out-
standing 2006 due in 1 year
due after 1
year
due after 5
years
average
remaining
term
(in years)
amount
outstanding
2005
Eurobonds 5.8 - 7.1 6.0 2,445 − 2,445 − 2.3 2,447
USD bonds 7.2 - 7.8 7.4 307 − 307 307 14.7 429
USD putable bonds 7.1 - 7.1 7.1 77 − 77 77 18.4 224
Convertible debentures 0.0 - 0.0 − 136 136 − − − 155
Private fi nancing 2.0 - 9.0 5.2 8 1 7 − 3.7 8
Bank borrowings 2.0 - 20.1 5.5 119 2 117 − 3.6 416
Liabilities arising from
capital lease transactions 1.4 - 19.0 4.2 59 23 36 19 6.4 103
Other long-term debt 1.7 - 13.6 4.7 62 45 17 2 3.9 116
6.1 3,213 207 3,006 405 3,898
Corresponding data
of previous year 5.9 3,898 578 3,320 1,214 4,039
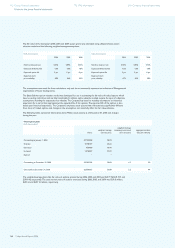
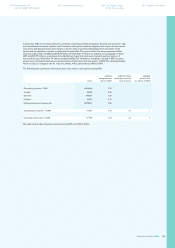
The following amounts of long-term debt, as at December 31, 2006,
are due in the next fi ve years:
2007 207
2008 1,708
2009 12
2010 128
2011 753
2,808
Corresponding amount
previous year 2,684
As of December 31, 2006, Philips had outstanding public bonds of
EUR 2,829 million previously issued mostly in USD or EUR. One of
the USD bonds with a total outstanding balance at December 31, 2006
of USD 103 million carrying a coupon of 7.125%, due 2025, carries
an option of each holder to put the bond to the Company on May 15,
2007, upon giving notice to the Company between March 15 and
April 15, 2007.
If the put option is exercised by investors, the redemption value would
be equal to the principal amount, plus accrued interest until the date
of redemption. Assuming that investors require full repayment at the
relevant put date, the average remaining tenor of the total outstanding
long-term debt at the end of 2006 was 3.7 years, compared to 3.8
years in 2005. However, assuming that the ‘putable’ bonds will be
repaid at maturity, the average remaining tenor at the end of 2006 was
4.1 years, compared to 5.0 years at the end of 2005.
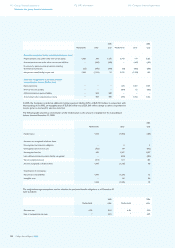
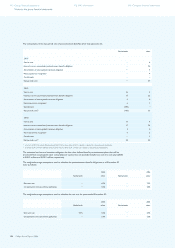
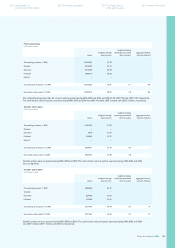
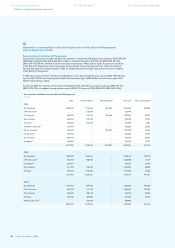
The following table provides additional details regarding the
outstanding bonds:
December 31
effective rate 2005 2006
Unsecured Eurobonds
Due 2/06/08; 7 1/8% 7.302% 130 130
Due 5/14/08; 7% 7.094% 61 61
Due 5/16/08; 5 3/4% 5.817% 1,500 1,500
Due 5/16/11; 6 1/8% 6.212% 750 750
Adjustments
1) 6 4
2,447 2,445
Unsecured USD Bonds
Due 5/15/25; 7 3/4% 8.010% 84 75
Due 6/01/26; 7 1/5% 7.426% − 126
Due 8/15/13; 7 1/4% 7.554% 121 109
Due 9/15/06; 8 3/8% 8.739% 226 −
Adjustments
1) (2 ) (3 )
429 307
Unsecured USD Bonds
subject to put
Due 5/15/25, put date
5/15/07; 7 1/8 % 7.361 % 87 78
Due 6/01/26, put date
6/1/06; 7 1/5 % 7.426 % 140 −
Adjustments
1) (3 ) (1 )
224 77
1) Adjustments relate to issued bond discounts, transaction costs and fair value
adjustments for interest rate derivatives.
112 Group fi nancial statements
Notes to the group fi nancial statements
172 IFRS information 218 Company fi nancial statements