Philips 2006 Annual Report Download - page 134
Download and view the complete annual report
Please find page 134 of the 2006 Philips annual report below. You can navigate through the pages in the report by either clicking on the pages listed below, or by using the keyword search tool below to find specific information within the annual report.-
 1
1 -
2
-
3
-
4
-
5
-
6
-
7
-
8
-
9
-
10
-
11
-
12
-
13
-
14
-
15
-
16
-
17
-
18
-
19
-
20
-
21
-
22
-
23
-
24
-
25
-
26
-
27
-
28
-
29
-
30
-
31
-
32
-
33
-
34
-
35
-
36
-
37
-
38
-
39
-
40
-
41
-
42
-
43
-
44
-
45
-
46
-
47
-
48
-
49
-
50
-
51
-
52
-
53
-
54
-
55
-
56
-
57
-
58
-
59
-
60
-
61
-
62
-
63
-
64
-
65
-
66
-
67
-
68
-
69
-
70
-
71
-
72
-
73
-
74
-
75
-
76
-
77
-
78
-
79
-
80
-
81
-
82
-
83
-
84
-
85
-
86
-
87
-
88
-
89
-
90
-
91
-
92
-
93
-
94
-
95
-
96
-
97
-
98
-
99
-
100
-
101
-
102
-
103
-
104
-
105
-
106
-
107
-
108
-
109
-
110
-
111
-
112
-
113
-
114
-
115
-
116
-
117
-
118
-
119
-
120
-
121
-
122
-
123
-
 124
124 -
 125
125 -
 126
126 -
 127
127 -
 128
128 -
 129
129 -
 130
130 -
 131
131 -
 132
132 -
 133
133 -
 134
134 -
 135
135 -
 136
136 -
 137
137 -
 138
138 -
 139
139 -
 140
140 -
 141
141 -
 142
142 -
 143
143 -
 144
144 -
145
-
146
-
147
-
148
-
149
-
150
-
151
-
152
-
153
-
154
-
155
-
156
-
157
-
158
-
159
-
160
-
161
-
162
-
163
-
164
-
165
-
166
-
167
-
168
-
169
-
170
-
171
-
172
-
173
-
174
-
175
-
176
-
177
-
178
-
179
-
180
-
181
-
182
-
183
-
184
-
185
-
186
-
187
-
188
-
189
-
190
-
191
-
192
-
193
-
194
-
195
-
196
-
197
-
198
-
199
-
200
-
201
-
202
-
203
-
204
-
205
-
206
-
207
-
208
-
209
-
210
-
211
-
212
-
213
-
214
-
215
-
216
-
217
-
218
-
219
-
220
-
221
-
222
-
223
-
224
-
225
-
226
-
227
-
228
-
229
-
230
-
231
-
232
-
233
-
234
-
235
-
236
-
237
-
238
-
239
-
240
-
241
-
242
-
243
-
244
 |
 |

Philips Annual Report 2006134
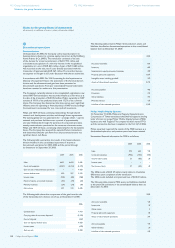
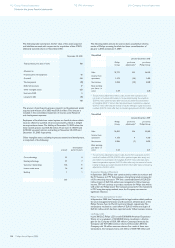
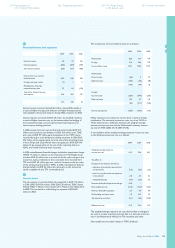
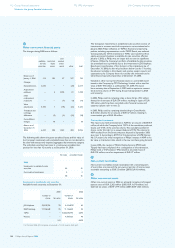
The following table summarizes the fair value of the assets acquired
and liabilities assumed with respect to the acquisition of the 47.25%
additional Lumileds shares in November 2005:
November 28, 2005
Total purchase price (net of cash) 788
Allocated to:
Property, plant and equipment 62
Goodwill 554
Working capital (78 )
Deferred tax assets 17
Other intangible assets 263
In-process R&D 6
Long-term debt (36 )
788
The amount of purchased in-process research and development assets
acquired and written off in 2005 was EUR 6 million. This amount is
included in the consolidated statement of income under Research
and development expenses.
Employees of Lumileds have vested options on Lumileds shares which
must be offered to Lumileds when executed and Lumileds is obliged
to acquire these shares. The liability at December 31, 2005 related to
these vested options was EUR 86 million. There were 3,187,545 and
3,018,442 unvested options outstanding at November 28, 2005 and
December 31, 2005 respectively.
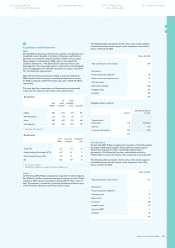
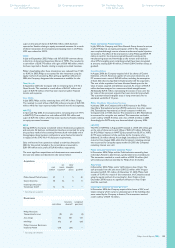
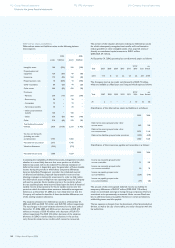
Other intangible assets, excluding in-process research and development,
is comprised of the following:
amount
amortization
period in years
Core technology 55 8
Existing technology 91 7
Customer relationships 102 11
Luxeon trade name 14 16
Backlog 1 1
263
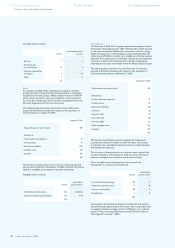
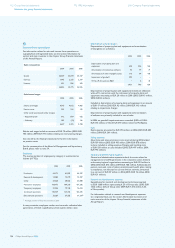
The following tables present the year-to-date unaudited pro-forma
results of Philips, assuming Lumileds had been consolidated as of
January 1, 2005 and January 1, 2004.
Unaudited
January-December 2005
Philips
Group
pro forma
adjustments
1)
pro forma
Philips Group
Sales 25,775 235 26,010
Income from
operations 1,472 (20 ) 1,452
Net income 2,868 (20 ) 2,848
Basic earnings
per share - in
euros 2.29 2.28
1) The pro forma adjustments relate to sales, Income from operations and
net results of Lumileds attributable to the period preceding the acquisition
(EUR 42 million positive impact after tax) and also refl ect the amortization
of intangibles (EUR 17 million after tax), share-based compensation expense
(EUR 23 million after tax), the reversal of results relating to equity-accounted
investees (EUR 18 million after tax) and remaining adjustments of EUR 4 million.
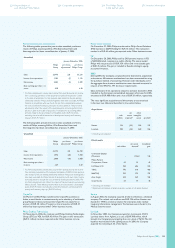
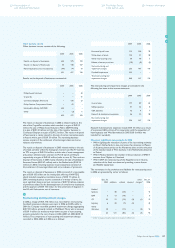
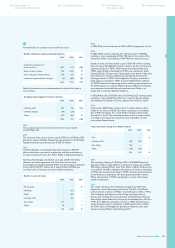
Unaudited
January-December 2004
Philips
Group
pro forma
adjustments
1)
pro forma
Philips Group
Sales 24,855 234 25,089
Income from
operations 1,156 4 1,160
Net income 2,836 (7 ) 2,829
Basic earnings
per share - in
euros 2.22 2.21
1) The pro forma adjustments relate to sales, Income from operations and net
results of Lumileds of 2004 (EUR 52 million positive impact after taxes) and
also refl ect the amortization of intangibles (EUR 19 million after tax), share-
based compensation expense (EUR 13 million after tax), the reversal of results
relating to equity-accounted investees (EUR 23 million after tax) and remaining
adjustments of EUR 4 million.
Connected Displays (Monitors)
In September 2005, Philips sold certain activities within its monitors and
fl at TV business to TPV Technologies, a Hong Kong listed company, for
a 15% ownership interest in TPV and a convertible bond of EUR 220
million. A gain of EUR 136 million was recognized in Other business
income. TPV will continue to produce monitors for Philips that will be
sold under the Philips brand. The Company accounts for the investment
in TPV using the equity method since the Company can exercise
signifi cant infl uence.
Philips Pension Competence Center
In September 2005, the Company sold the legal entities which perform
the asset management function and the pension administration of the
Philips Pension Fund to Merrill Lynch and Hewitt, respectively. The
transactions resulted in a cash infl ow of EUR 55 million and a gain of
EUR 42 million, which has been reported under Other business income.
LG.Philips LCD
In July 2005, LG.Philips LCD issued 65,000,000 American Depository
Shares or an equivalent of 32,500,000 shares, resulting in a dilution
gain for the Company of EUR 189 million. Contemporaneously, the
Company sold 9,375,000 common shares. In December 2005 the
Company sold 18 million common shares. As a result of these two
transactions, the Company had a cash infl ow of EUR 938 million and
112 Group fi nancial statements
Notes to the group fi nancial statements
172 IFRS information 218 Company fi nancial statements