Philips 2006 Annual Report Download - page 208
Download and view the complete annual report
Please find page 208 of the 2006 Philips annual report below. You can navigate through the pages in the report by either clicking on the pages listed below, or by using the keyword search tool below to find specific information within the annual report.-
 1
1 -
2
-
3
-
4
-
5
-
6
-
7
-
8
-
9
-
10
-
11
-
12
-
13
-
14
-
15
-
16
-
17
-
18
-
19
-
20
-
21
-
22
-
23
-
24
-
25
-
26
-
27
-
28
-
29
-
30
-
31
-
32
-
33
-
34
-
35
-
36
-
37
-
38
-
39
-
40
-
41
-
42
-
43
-
44
-
45
-
46
-
47
-
48
-
49
-
50
-
51
-
52
-
53
-
54
-
55
-
56
-
57
-
58
-
59
-
60
-
61
-
62
-
63
-
64
-
65
-
66
-
67
-
68
-
69
-
70
-
71
-
72
-
73
-
74
-
75
-
76
-
77
-
78
-
79
-
80
-
81
-
82
-
83
-
84
-
85
-
86
-
87
-
88
-
89
-
90
-
91
-
92
-
93
-
94
-
95
-
96
-
97
-
98
-
99
-
100
-
101
-
102
-
103
-
104
-
105
-
106
-
107
-
108
-
109
-
110
-
111
-
112
-
113
-
114
-
115
-
116
-
117
-
118
-
119
-
120
-
121
-
122
-
123
-
124
-
125
-
126
-
127
-
128
-
129
-
130
-
131
-
132
-
133
-
134
-
135
-
136
-
137
-
138
-
139
-
140
-
141
-
142
-
143
-
144
-
145
-
146
-
147
-
148
-
149
-
150
-
151
-
152
-
153
-
154
-
155
-
156
-
157
-
158
-
159
-
160
-
161
-
162
-
163
-
164
-
165
-
166
-
167
-
168
-
169
-
170
-
171
-
172
-
173
-
174
-
175
-
176
-
177
-
178
-
179
-
180
-
181
-
182
-
183
-
184
-
185
-
186
-
187
-
188
-
189
-
190
-
191
-
192
-
193
-
194
-
195
-
196
-
197
-
 198
198 -
 199
199 -
 200
200 -
 201
201 -
 202
202 -
 203
203 -
 204
204 -
 205
205 -
 206
206 -
 207
207 -
 208
208 -
 209
209 -
 210
210 -
 211
211 -
 212
212 -
 213
213 -
 214
214 -
 215
215 -
 216
216 -
 217
217 -
 218
218 -
219
-
220
-
221
-
222
-
223
-
224
-
225
-
226
-
227
-
228
-
229
-
230
-
231
-
232
-
233
-
234
-
235
-
236
-
237
-
238
-
239
-
240
-
241
-
242
-
243
-
244
 |
 |

Philips Annual Report 2006208
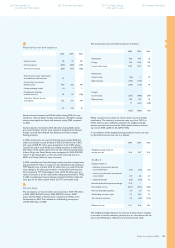
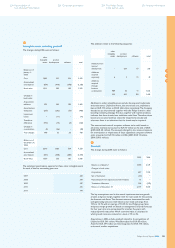
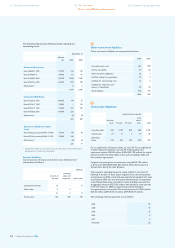
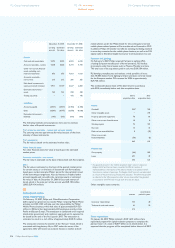
Plan assets in the Netherlands
The Company’s pension plan asset allocation in the Netherlands at
December 31, 2005 and 2006 and target allocation 2007 is as follows:
Percentage of plan assets at December 31
2005 2006 2007
actual actual target
Matching
portfolio: 60 57 56
Debt
securities
-
60 57 56
Return
portfolio: 40 43 44
Equity
securities
-
28 29 29
Debt
securities
-
− − −
Real estate - 9 9 11
Other - 3 5 4
100 100 100
Plan assets in other countries
The Company’s pension plan asset allocation in other countries at
December 31, 2005 and 2006 and target allocation 2007 is as follows:
Percentage of plan assets at December 31
2005 2006 2007
actual actual target
Equity securities 39 26 20
Debt securities 52 68 72
Real estate 6 2 2
Other 3 4 6
100 100 100
Plan assets include property occupied by the Philips Group with
a fair value of EUR 42 million (2005: EUR 42 million).
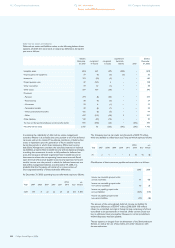
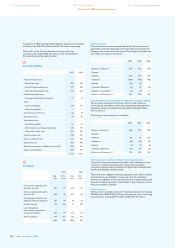
Pension expense of defi ned-benefi t plans recognized in the
income statement:
2004 2005 2006
Service cost 305 343 327
Interest cost on the projected
benefi t obligation 985 949 942
Expected return on plan assets (1,077 ) (1,102 ) (1,214 )
Net actuarial (gain) loss recognized 424 (607 ) (82 )
Prior-service cost (761 ) (28 ) 6
Settlement loss 14 3 5
Curtailment benefi t − (4 ) (25 )
Unrecognized net assets 518 878 436
Other (10) 2 31
398 434 426
of which discontinued operations 53 52 45
Actual return on plan assets 2,091 2,495 1,050
The unrecognized net assets are primarily related to the prepaid
pension asset in the Netherlands.
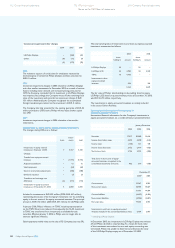
The pension expense of defi ned-benefi t plans is recognized in
the following line items:
2004 2005 2006
Cost of sales 83 99 67
Selling expenses 57 47 55
General and administrative expenses 223 253 268
Research and development expenses 35 35 36
398 434 426
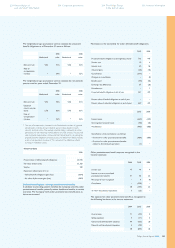
The Company also sponsors defi ned-contribution and similar types of
plans for a signifi cant number of salaried employees. The total cost of
these plans amounted to EUR 91 million in 2006 (2005: EUR 68 million,
2004: EUR 54 million) of which EUR 11 million (2005: EUR 12 million,
2004: EUR 11 million) relates to Semiconductors and has been
presented under discontinued operations. In 2006, the defi ned-
contribution cost includes contributions to multi-employer plans of
to EUR 4 million (2005: EUR 3 million, 2004: EUR 1 million).
Cash fl ows
The Company expects considerable cash outfl ows in relation to
employee benefi ts which are estimated to amount to EUR 433 million
in 2007, consisting of EUR 288 million employer contributions to
defi ned-benefi t pension plans, EUR 80 million employer contributions
to defi ned-contribution pension plans, and EUR 65 million expected
cash outfl ows in relation to unfunded pension plans. The employer
contributions to defi ned-benefi t pension plans are expected to amount
to EUR 160 million for the Netherlands and EUR 128 million for
other countries.
Expected returns per asset class are based on the assumption that
asset valuations tend to return to their respective long-term equilibria.
The Expected Return on Assets for any funded plan equals the average
of the expected returns per asset class weighted by their portfolio
weights in accordance with the fund’s strategic asset allocation.
112 Group fi nancial statements 172 IFRS information
Notes to the IFRS fi nancial statements
218 Company fi nancial statements