Philips 2006 Annual Report Download - page 40
Download and view the complete annual report
Please find page 40 of the 2006 Philips annual report below. You can navigate through the pages in the report by either clicking on the pages listed below, or by using the keyword search tool below to find specific information within the annual report.-
 1
1 -
2
-
3
-
4
-
5
-
6
-
7
-
8
-
9
-
10
-
11
-
12
-
13
-
14
-
15
-
16
-
17
-
18
-
19
-
20
-
21
-
22
-
23
-
24
-
25
-
26
-
27
-
28
-
29
-
 30
30 -
 31
31 -
 32
32 -
 33
33 -
 34
34 -
 35
35 -
 36
36 -
 37
37 -
 38
38 -
 39
39 -
 40
40 -
 41
41 -
 42
42 -
 43
43 -
 44
44 -
 45
45 -
 46
46 -
 47
47 -
 48
48 -
 49
49 -
 50
50 -
51
-
52
-
53
-
54
-
55
-
56
-
57
-
58
-
59
-
60
-
61
-
62
-
63
-
64
-
65
-
66
-
67
-
68
-
69
-
70
-
71
-
72
-
73
-
74
-
75
-
76
-
77
-
78
-
79
-
80
-
81
-
82
-
83
-
84
-
85
-
86
-
87
-
88
-
89
-
90
-
91
-
92
-
93
-
94
-
95
-
96
-
97
-
98
-
99
-
100
-
101
-
102
-
103
-
104
-
105
-
106
-
107
-
108
-
109
-
110
-
111
-
112
-
113
-
114
-
115
-
116
-
117
-
118
-
119
-
120
-
121
-
122
-
123
-
124
-
125
-
126
-
127
-
128
-
129
-
130
-
131
-
132
-
133
-
134
-
135
-
136
-
137
-
138
-
139
-
140
-
141
-
142
-
143
-
144
-
145
-
146
-
147
-
148
-
149
-
150
-
151
-
152
-
153
-
154
-
155
-
156
-
157
-
158
-
159
-
160
-
161
-
162
-
163
-
164
-
165
-
166
-
167
-
168
-
169
-
170
-
171
-
172
-
173
-
174
-
175
-
176
-
177
-
178
-
179
-
180
-
181
-
182
-
183
-
184
-
185
-
186
-
187
-
188
-
189
-
190
-
191
-
192
-
193
-
194
-
195
-
196
-
197
-
198
-
199
-
200
-
201
-
202
-
203
-
204
-
205
-
206
-
207
-
208
-
209
-
210
-
211
-
212
-
213
-
214
-
215
-
216
-
217
-
218
-
219
-
220
-
221
-
222
-
223
-
224
-
225
-
226
-
227
-
228
-
229
-
230
-
231
-
232
-
233
-
234
-
235
-
236
-
237
-
238
-
239
-
240
-
241
-
242
-
243
-
244
 |
 |
Philips Annual Report 200640
a
total consideration of EUR 7,913 million and a
simultaneous
acquisition of a minority interest in
the recapitalized organization at a cost of EUR 854
million. A gain of EUR 4,283 million was recorded
on the sale, net of costs directly associated with this
transaction of approximately EUR 367 million.
The Company’s ownership interest in the recapitalized
organization, now named NXP Semiconductors, was
recorded at its fair value of EUR 854 million. Philips’
ownership consists of 19.9% of the preferred shares
and 17.5% of the common shares.
The Company reported its stake in the recapitalized NXP
Semiconductors under other non-current fi nancial assets.
In this Annual Report, Philips reports the results of
the MDS and Semiconductors businesses separately
as discontinued operations. Consequently, the results
of the MDS and Semiconductors businesses, including
transaction gains, are shown separately in the fi nancial
statements as results from discontinued operations.
In 2005, Semiconductors was reported as part of the
Philips Group while MDS was classifi ed as a discontinued
operation. In accordance with the applicable accounting
principles, previous years have been restated.
Net income
Net income amounted to EUR 5,383 million (EUR 4.58
per common share), of which income from continuing
operations was EUR 919 million and EUR 4,464 million
related to discontinued operations. In 2005, net income
amounted to EUR 2,868 million, of which EUR 2,831
million was income from continuing operations.
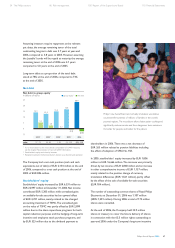
Performance by region
Sales per region
in millions of euros
20041) 20051) 2006
Europe and Africa 11,703 11,520 12,140
North America 6,944 7,502 7,885
Latin America 1,376 1,804 1,970
Asia Pacifi c 4,832 4,949 4,981
24,855 25,775 26,976
1) Restated to present the Semiconductors division as a discontinued operation
EBIT per region
in millions of euros
20041) 20051) 2006
Europe and Africa 884 1,089 1,083
North America 38 153 (159)
Latin America 51 92 62
Asia Pacifi c 183 138 197
1,156 1,472 1,183
1) Restated to present the Semiconductors division as a discontinued operation
In 2006, sales in Europe showed a strong increase
of 8% on a comparable basis, with divestments having
a downward effect of 3%. Comparable sales growth was
visible in all sectors, led by double-digit growth rates
at DAP and CE (both 10%), followed by Lighting and
Medical Systems with sales increases of 8% and 6%
respectively. Other Activities’ sales declined by 21% in
nominal terms, entirely due to divestments, while sales
were stable on a comparable basis.
Comparable sales in the emerging markets in Eastern
Europe showed a 19% increase, with double-digit growth
rates evident in all operating sectors, notably in Medical
Systems with 33%. Russia and Ukraine, accounting for
around 40% of the Company’s sales in Eastern Europe,
showed strong sales growth of 27% and 57% respectively.
Sales in North America increased by 5%, both nominally
and comparably, and were particularly strong in DAP,
with
a growth rate of 11%, predominantly attributable to sales
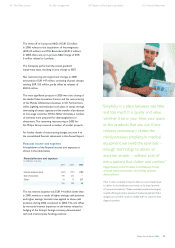
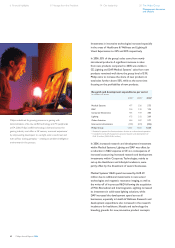
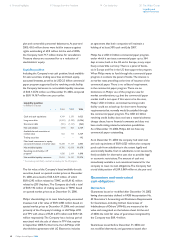
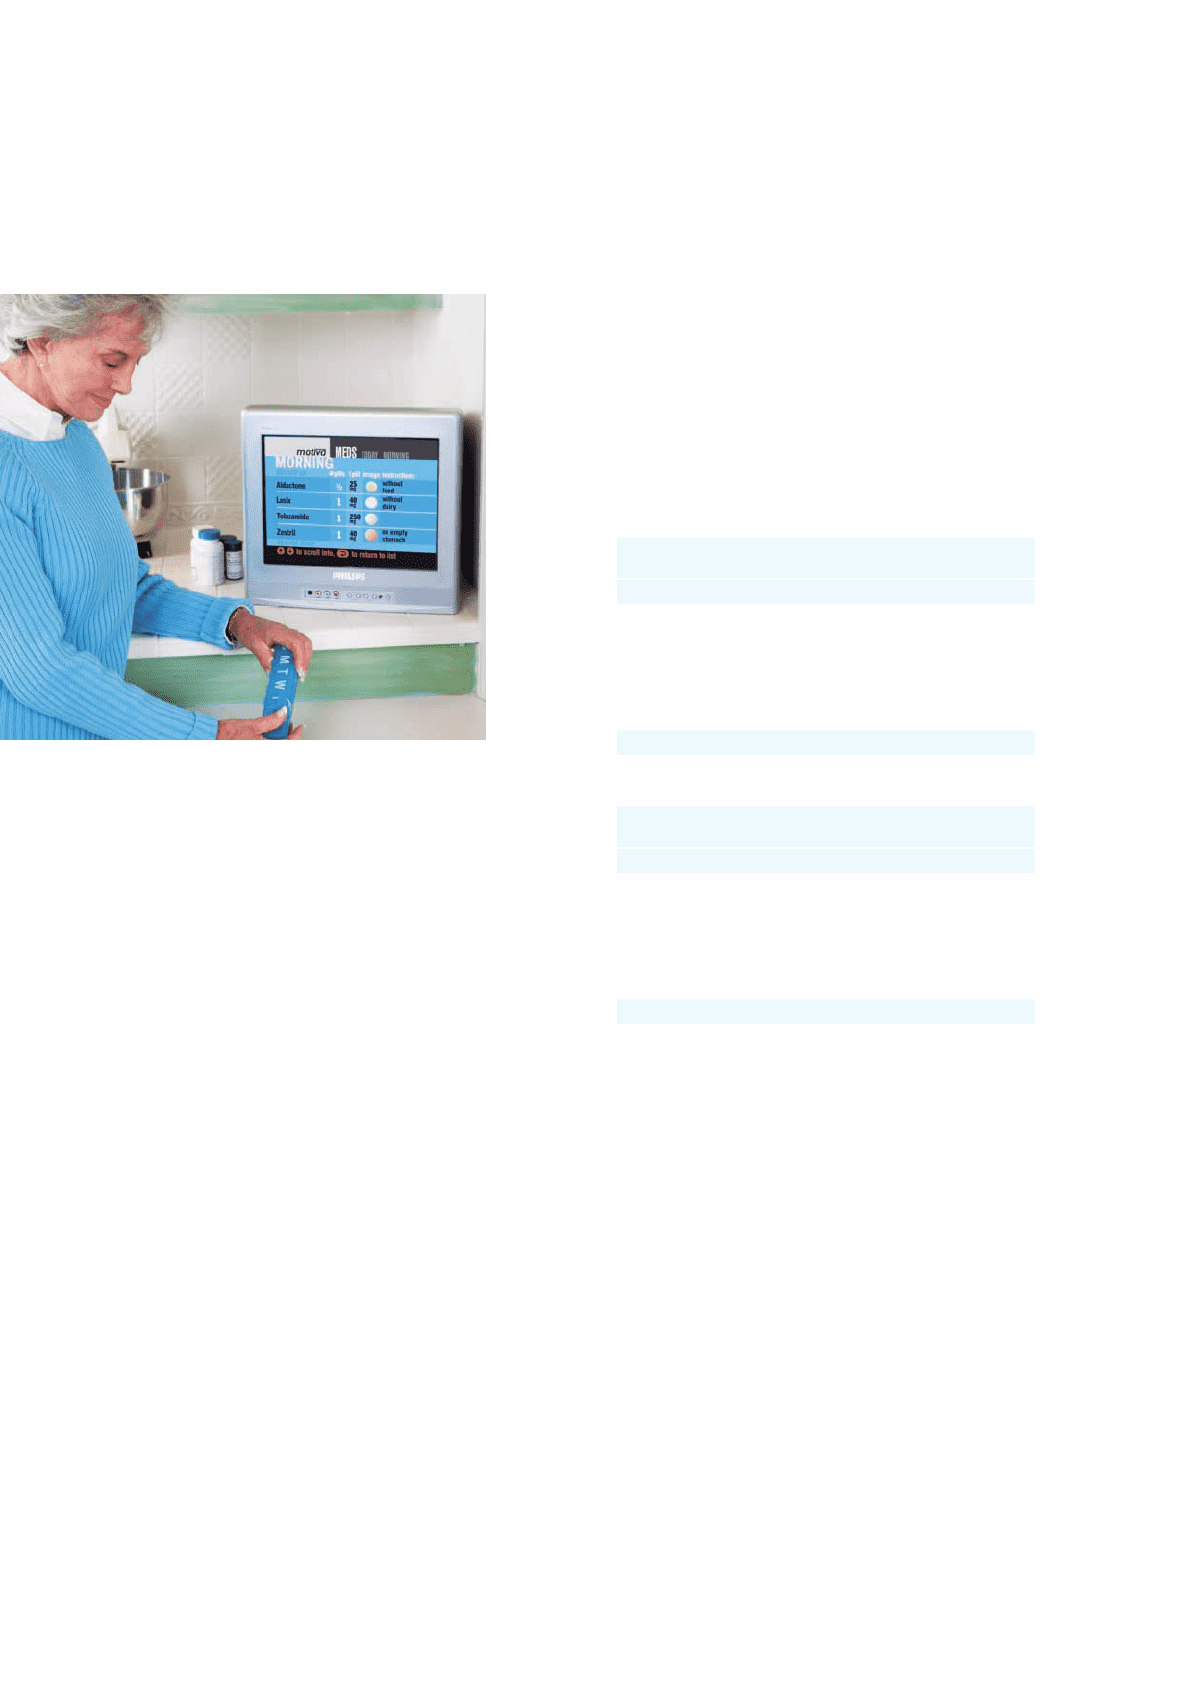
Motiva, a TV-based platform for remote patient management,
was launched on the US and European markets in 2006. Besides
vital-sign monitoring, Motiva engages patients with personalized
interactive content, helping care managers reach more patients,
infl uence long-term behavior and lower healthcare costs.
6 Financial highlights 8 Message from the President 14 Our leadership 20 The Philips Group
Management discussion
and analysis