Philips 2006 Annual Report Download - page 34
Download and view the complete annual report
Please find page 34 of the 2006 Philips annual report below. You can navigate through the pages in the report by either clicking on the pages listed below, or by using the keyword search tool below to find specific information within the annual report.-
 1
1 -
2
-
3
-
4
-
5
-
6
-
7
-
8
-
9
-
10
-
11
-
12
-
13
-
14
-
15
-
16
-
17
-
18
-
19
-
20
-
21
-
22
-
23
-
 24
24 -
 25
25 -
 26
26 -
 27
27 -
 28
28 -
 29
29 -
 30
30 -
 31
31 -
 32
32 -
 33
33 -
 34
34 -
 35
35 -
 36
36 -
 37
37 -
 38
38 -
 39
39 -
 40
40 -
 41
41 -
 42
42 -
 43
43 -
 44
44 -
45
-
46
-
47
-
48
-
49
-
50
-
51
-
52
-
53
-
54
-
55
-
56
-
57
-
58
-
59
-
60
-
61
-
62
-
63
-
64
-
65
-
66
-
67
-
68
-
69
-
70
-
71
-
72
-
73
-
74
-
75
-
76
-
77
-
78
-
79
-
80
-
81
-
82
-
83
-
84
-
85
-
86
-
87
-
88
-
89
-
90
-
91
-
92
-
93
-
94
-
95
-
96
-
97
-
98
-
99
-
100
-
101
-
102
-
103
-
104
-
105
-
106
-
107
-
108
-
109
-
110
-
111
-
112
-
113
-
114
-
115
-
116
-
117
-
118
-
119
-
120
-
121
-
122
-
123
-
124
-
125
-
126
-
127
-
128
-
129
-
130
-
131
-
132
-
133
-
134
-
135
-
136
-
137
-
138
-
139
-
140
-
141
-
142
-
143
-
144
-
145
-
146
-
147
-
148
-
149
-
150
-
151
-
152
-
153
-
154
-
155
-
156
-
157
-
158
-
159
-
160
-
161
-
162
-
163
-
164
-
165
-
166
-
167
-
168
-
169
-
170
-
171
-
172
-
173
-
174
-
175
-
176
-
177
-
178
-
179
-
180
-
181
-
182
-
183
-
184
-
185
-
186
-
187
-
188
-
189
-
190
-
191
-
192
-
193
-
194
-
195
-
196
-
197
-
198
-
199
-
200
-
201
-
202
-
203
-
204
-
205
-
206
-
207
-
208
-
209
-
210
-
211
-
212
-
213
-
214
-
215
-
216
-
217
-
218
-
219
-
220
-
221
-
222
-
223
-
224
-
225
-
226
-
227
-
228
-
229
-
230
-
231
-
232
-
233
-
234
-
235
-
236
-
237
-
238
-
239
-
240
-
241
-
242
-
243
-
244
 |
 |

Philips Annual Report 200634
million on the sale of the majority stake in the
Semiconductors division and lower income tax,
partly offset by the lower operational result of LG.
Philips LCD. Net income in 2005 included a EUR 1,778
million gain on the sale of several fi nancial holdings,
partly offset by a EUR 416 million impairment charge
for LG. Philips Displays.
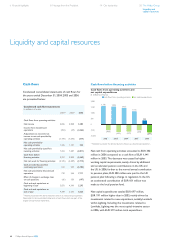
Cash fl ows before fi nancing activities provided by
continuing operations decreased from EUR 2,828 million
in 2005 to a cash outfl ow of EUR 2,469 million in 2006,
which was mainly due to several acquisitions and higher
pension contributions in the United Kingdom and United
States. Cash fl ows in 2005 were positively affected by the
sale of several fi nancial holdings, mainly in NAVTEQ,
TSMC and LG.Philips LCD.
In 2006, Philips cancelled over 173 million shares. During
the year, 102 million shares were repurchased, thereby
returning EUR 3.3 billion to shareholders including the
annual dividend.
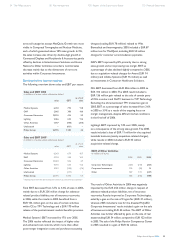
Performance of the Group
Income statement
in millions of euros unless otherwise stated
20041) 20051) 2006
Sales 24,855 25,775 26,976
Earnings before interest and tax 1,156 1,472 1,183
as a % of sales 4.7 5.7 4.4
Financial income and expenses 216 108 34
Income tax expense (230) ( 506) (137)
Results of equity-accounted investees 1,464 1,754 (157)
Minority interests (22) 3 (4)
Income from continuing operations 2,584 2,831 919
Discontinued operations 252 37 4,464
Net income 2,836 2,868 5,383
Per common share (in euro) − basic 2.22 2.29 4.58
Per common share (in euro) − diluted
2.21 2.29 4.55
1) Restated to present the Semiconductors division as a discontinued operation
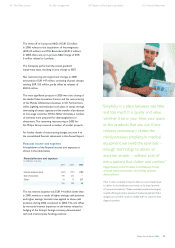
Sales
In percentage terms, the composition of the growth
in sales in 2006, compared with 2005, was as follows:
Sales growth composition 2006 versus 20051)
in %
com-
parable
growth
currency
effects
consoli-
dation
changes
nominal
growth
Medical Systems 7.3 (1.1) 0.1 6.3
DAP 11.2 (0.1) 9.4 20.5
Consumer Electronics 5.4 0.1 (4.0) 1.5
Lighting 8.3 (0.3) 6.5 14.5
Other Activities (6.8) (0.4) (17.0) (24.2)
Philips Group 6.1 (0.3) (1.1) 4.7
1) Restated to present the Semiconductors division as a discontinued operation
Sales in 2006 increased by 4.7% on a nominal basis
and 6.1% on a comparable basis, to EUR 26,976 million.
The net effect of acquisitions, divestments and currency
movements resulted in a net decline of 1.4%. On a
comparable basis, sales growth was particularly strong
in DAP and Lighting.
The robust comparable growth at DAP was primarily
driven by Shaving & Beauty, Oral Healthcare and Domestic
Appliances, each of which showed double-digit growth.
The Lighting increase was attributable to double-digit
comparable growth in Luminaires and Automotive, Special
Lighting & UHP. Medical Systems achieved sales growth
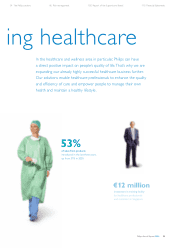
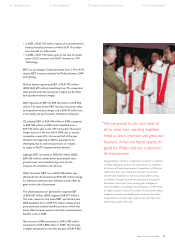
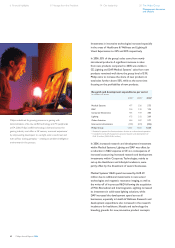
Together with the Catharina Hospital in Eindhoven, Netherlands,
Philips introduced the fi rst Ambient Experience Catheterization
Lab, putting patient well-being at the center of the hospital
experience. Ambient Experience solutions combine lighting
and consumer electronics to create an environment that is
both friendly and reassuring for patients and more effective
for physicians, thus improving the quality of healthcare.
6 Financial highlights 8 Message from the President 14 Our leadership 20 The Philips Group
Management discussion
and analysis