Philips 2006 Annual Report Download - page 44
Download and view the complete annual report
Please find page 44 of the 2006 Philips annual report below. You can navigate through the pages in the report by either clicking on the pages listed below, or by using the keyword search tool below to find specific information within the annual report.-
 1
1 -
2
-
3
-
4
-
5
-
6
-
7
-
8
-
9
-
10
-
11
-
12
-
13
-
14
-
15
-
16
-
17
-
18
-
19
-
20
-
21
-
22
-
23
-
24
-
25
-
26
-
27
-
28
-
29
-
30
-
31
-
32
-
33
-
 34
34 -
 35
35 -
 36
36 -
 37
37 -
 38
38 -
 39
39 -
 40
40 -
 41
41 -
 42
42 -
 43
43 -
 44
44 -
 45
45 -
 46
46 -
 47
47 -
 48
48 -
 49
49 -
 50
50 -
 51
51 -
 52
52 -
 53
53 -
 54
54 -
55
-
56
-
57
-
58
-
59
-
60
-
61
-
62
-
63
-
64
-
65
-
66
-
67
-
68
-
69
-
70
-
71
-
72
-
73
-
74
-
75
-
76
-
77
-
78
-
79
-
80
-
81
-
82
-
83
-
84
-
85
-
86
-
87
-
88
-
89
-
90
-
91
-
92
-
93
-
94
-
95
-
96
-
97
-
98
-
99
-
100
-
101
-
102
-
103
-
104
-
105
-
106
-
107
-
108
-
109
-
110
-
111
-
112
-
113
-
114
-
115
-
116
-
117
-
118
-
119
-
120
-
121
-
122
-
123
-
124
-
125
-
126
-
127
-
128
-
129
-
130
-
131
-
132
-
133
-
134
-
135
-
136
-
137
-
138
-
139
-
140
-
141
-
142
-
143
-
144
-
145
-
146
-
147
-
148
-
149
-
150
-
151
-
152
-
153
-
154
-
155
-
156
-
157
-
158
-
159
-
160
-
161
-
162
-
163
-
164
-
165
-
166
-
167
-
168
-
169
-
170
-
171
-
172
-
173
-
174
-
175
-
176
-
177
-
178
-
179
-
180
-
181
-
182
-
183
-
184
-
185
-
186
-
187
-
188
-
189
-
190
-
191
-
192
-
193
-
194
-
195
-
196
-
197
-
198
-
199
-
200
-
201
-
202
-
203
-
204
-
205
-
206
-
207
-
208
-
209
-
210
-
211
-
212
-
213
-
214
-
215
-
216
-
217
-
218
-
219
-
220
-
221
-
222
-
223
-
224
-
225
-
226
-
227
-
228
-
229
-
230
-
231
-
232
-
233
-
234
-
235
-
236
-
237
-
238
-
239
-
240
-
241
-
242
-
243
-
244
 |
 |

Philips Annual Report 200644
Cash fl ows
Condensed consolidated statements of cash fl ows for
the years ended December 31, 2004, 2005 and 2006
are presented below:
Condensed cash fl ow statements
in millions of euros
20041) 20051) 2006
Cash fl ows from operating activities:
Net income 2,836 2,868 5,383
Income from discontinued
operations (252) (37) (4,464)
Adjustments to reconcile net
income to net cash provided by
operating activities (1,149) (1,690) (577)
Net cash provided by
operating activities 1,435 1,141 342
Net cash provided by (used for)
investing activities 1,322 1,687 (2,811)
Cash fl ows before
fi nancing activities 2,757 2,828 (2,469)
Net cash used for fi nancing activities (2,145) (2,589) (3,715)
Cash provided by (used for)
continuing operations 612 239 (6,184)
Net cash provided by discontinued
operations 710 546 7,111
Effect of changes in exchange rates
on cash positions (45) 159 (197)
Cash and cash equivalents at
beginning of year 3,072 4,349 5,293
Cash and cash equivalents at
end of year 4,349 5,293 6,023
1) Restated to present the Semiconductors division as a discontinued operation.
Please refer to the consolidated statements of cash fl ows which are part of the
chapter Group fi nancial statements.
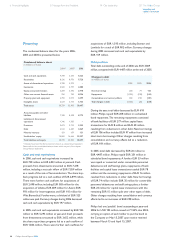
Cash fl ows before fi nancing activities
Cash flows from operating activitiesand
net capital expenditures
in millions of euros
cash flows from operating activities net capital expenditures
2,000
1,500
1,000
500
0
(500)
(1,000)
1,592
(499)
20021)
1,553
(652)
20031)
1,435
(625)
20041)
1,141
(506)
20051)
342
(697)
2006
1) Restated to present the Semiconductors division as a discontinued operation.
Net cash from operating activities amounted to EUR 342
million in 2006 compared to a cash fl ow of EUR 1,141
million in 2005. The decrease was caused by higher
working capital requirements, mainly driven by additional
and accelerated pension contributions in the UK and
the US. In 2006, further to the normal annual contribution
to pension plans, EUR 582 million was paid to the UK
pension plan following a change in regulation. In the US,
an accelerated contribution of EUR 101 million was
made to the local pension fund.
Net capital expenditures totaled EUR 697 million,
EUR 191 million higher than in 2005, mainly driven by
investments related to new acquisitions, notably Lumileds
within Lighting. Including the investments related to
Lumileds, Lighting was the most capital-intensive sector
in 2006, with EUR 319 million total expenditure.
Liquidity and capital resources
6 Financial highlights 8 Message from the President 14 Our leadership 20 The Philips Group
Liquidity and
capital resources