Philips 2006 Annual Report Download - page 35
Download and view the complete annual report
Please find page 35 of the 2006 Philips annual report below. You can navigate through the pages in the report by either clicking on the pages listed below, or by using the keyword search tool below to find specific information within the annual report.-
 1
1 -
2
-
3
-
4
-
5
-
6
-
7
-
8
-
9
-
10
-
11
-
12
-
13
-
14
-
15
-
16
-
17
-
18
-
19
-
20
-
21
-
22
-
23
-
24
-
 25
25 -
 26
26 -
 27
27 -
 28
28 -
 29
29 -
 30
30 -
 31
31 -
 32
32 -
 33
33 -
 34
34 -
 35
35 -
 36
36 -
 37
37 -
 38
38 -
 39
39 -
 40
40 -
 41
41 -
 42
42 -
 43
43 -
 44
44 -
 45
45 -
46
-
47
-
48
-
49
-
50
-
51
-
52
-
53
-
54
-
55
-
56
-
57
-
58
-
59
-
60
-
61
-
62
-
63
-
64
-
65
-
66
-
67
-
68
-
69
-
70
-
71
-
72
-
73
-
74
-
75
-
76
-
77
-
78
-
79
-
80
-
81
-
82
-
83
-
84
-
85
-
86
-
87
-
88
-
89
-
90
-
91
-
92
-
93
-
94
-
95
-
96
-
97
-
98
-
99
-
100
-
101
-
102
-
103
-
104
-
105
-
106
-
107
-
108
-
109
-
110
-
111
-
112
-
113
-
114
-
115
-
116
-
117
-
118
-
119
-
120
-
121
-
122
-
123
-
124
-
125
-
126
-
127
-
128
-
129
-
130
-
131
-
132
-
133
-
134
-
135
-
136
-
137
-
138
-
139
-
140
-
141
-
142
-
143
-
144
-
145
-
146
-
147
-
148
-
149
-
150
-
151
-
152
-
153
-
154
-
155
-
156
-
157
-
158
-
159
-
160
-
161
-
162
-
163
-
164
-
165
-
166
-
167
-
168
-
169
-
170
-
171
-
172
-
173
-
174
-
175
-
176
-
177
-
178
-
179
-
180
-
181
-
182
-
183
-
184
-
185
-
186
-
187
-
188
-
189
-
190
-
191
-
192
-
193
-
194
-
195
-
196
-
197
-
198
-
199
-
200
-
201
-
202
-
203
-
204
-
205
-
206
-
207
-
208
-
209
-
210
-
211
-
212
-
213
-
214
-
215
-
216
-
217
-
218
-
219
-
220
-
221
-
222
-
223
-
224
-
225
-
226
-
227
-
228
-
229
-
230
-
231
-
232
-
233
-
234
-
235
-
236
-
237
-
238
-
239
-
240
-
241
-
242
-
243
-
244
 |
 |

Philips Annual Report 2006 35
across all categories except MedQuist. Growth was most
visible in Computed Tomography and Nuclear Medicine,
each of which generated above 10% sales growth. In CE,
the sales increase was driven by double-digit growth in
Connected Displays and Peripherals & Accessories, partly
offset by declines in Entertainment Solutions and Home
Networks. Other Activities recorded a nominal sales
decrease mainly due to the divestment of non-core
activities within Corporate Investments.
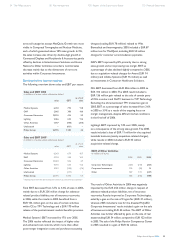
Earnings before interest and tax
The following overview shows sales and EBIT per sector.
Sales and EBIT 2006
in millions of euros unless otherwise stated
sales EBIT
as a % of
sales
Medical Systems 6,742 795 11.8
DAP 2,645 386 14.6
Consumer Electronics 10,576 416 3.9
Lighting 5,466 635 11.6
Other Activities 1,547 (448)(29.0)
Unallocated − (601)−
Philips Group 26,976 1,183 4.4
Sales and EBIT 20051)
in millions of euros unless otherwise stated
sales EBIT
as a % of
sales
Medical Systems 6,343 679 10.7
DAP 2,194 358 16.3
Consumer Electronics 10,422 506 4.9
Lighting 4,775 556 11.6
Other Activities 2,041 (156) (7.6)
Unallocated − (471) −
Philips Group 25,775 1,472 5.7
1) Restated to present the Semiconductors division as a discontinued operation
Total EBIT decreased from 5.7% to 4.4% of sales in 2006,
mainly due to a EUR 256 million charge for asbestos-
related product liabilities, net of insurance recoveries,
in 2006, while the results in 2005 benefi ted from a
EUR 136 million gain on the sale of certain activities
within CE to TPV Technology and a EUR 170 million
release of the postretirement medical benefi ts provision.
Medical Systems’ EBIT increased by 17% over 2005.
The 2006 results refl ected the impact of higher sales
and enhanced cost controls, which more than offset
post-merger integration costs and purchase-accounting
charges (totaling EUR 78 million) related to Witt
Biomedical and Intermagnetics. 2005 included a EUR 87
million loss for MedQuist, including EUR 50 million
charges for customer accommodation payments.
DAP’s EBIT improved by 8%, primarily due to strong
sales growth and an improved gross margin. EBIT as
a percentage of sales declined slightly compared to 2005,
due to acquisition-related charges for Avent (EUR 14
million) and Lifeline Systems (EUR 16 million) as well
as investments in Consumer Healthcare Solutions.
CE’s EBIT decreased from EUR 506 million in 2005 to
EUR 416 million in 2006. The 2005 result included a
EUR 136 million gain related to the sale of certain parts
of CE’s monitors and FlatTV business to TVP Technology.
Excluding the aforementioned TPV transaction gain in
2005, EBIT as a percentage of sales increased from 3.6%
in 2005 to 3.9% as a result of the ongoing focus on
margin management, despite diffi cult market conditions
in the fi rst half of 2006.
Lighting’s EBIT improved by 14% over 2005, mainly
as a consequence of the strong sales growth. The 2005
result included a loss of EUR 11 million for the acquired
Lumileds business (mainly acquisition-related charges),
while results in 2006 included a EUR 43 million
acquisition-related charge.
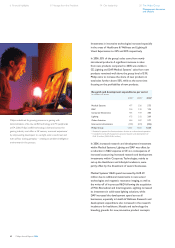
EBIT of Other Activities
in millions of euros
2004 2005 2006
Corporate Technologies (323) (219) (205)
Corporate Investments 102 (58) 14
Other 587 121 (257)
366 (156) (448)
The result of Other Activities in 2006 was negatively
impacted by the EUR 256 million charge in respect of
asbestos-related product liabilities, net of insurance
recoveries. Results improved at Corporate Technologies,
aided by a gain on the sale of CryptoTec (EUR 31 million),
whereas 2005 included a loss for the divested PolyLED.
Corporate Investments’ result included a gain on the sale
of businesses totaling EUR 44 million. The EBIT of Other
Activities was further affected by gains on the sale of real
estate totaling EUR 54 million, compared to EUR 122 million
in 2005. The sale of the Philips Pension Competence Center
in 2005 resulted in a gain of EUR 42 million.
54 The Philips sectors 86 Risk management 100 Report of the Supervisory Board 110 Financial Statements