Philips 2006 Annual Report Download - page 64
Download and view the complete annual report
Please find page 64 of the 2006 Philips annual report below. You can navigate through the pages in the report by either clicking on the pages listed below, or by using the keyword search tool below to find specific information within the annual report.-
 1
1 -
2
-
3
-
4
-
5
-
6
-
7
-
8
-
9
-
10
-
11
-
12
-
13
-
14
-
15
-
16
-
17
-
18
-
19
-
20
-
21
-
22
-
23
-
24
-
25
-
26
-
27
-
28
-
29
-
30
-
31
-
32
-
33
-
34
-
35
-
36
-
37
-
38
-
39
-
40
-
41
-
42
-
43
-
44
-
45
-
46
-
47
-
48
-
49
-
50
-
51
-
52
-
53
-
 54
54 -
 55
55 -
 56
56 -
 57
57 -
 58
58 -
 59
59 -
 60
60 -
 61
61 -
 62
62 -
 63
63 -
 64
64 -
 65
65 -
 66
66 -
 67
67 -
 68
68 -
 69
69 -
 70
70 -
 71
71 -
 72
72 -
 73
73 -
 74
74 -
75
-
76
-
77
-
78
-
79
-
80
-
81
-
82
-
83
-
84
-
85
-
86
-
87
-
88
-
89
-
90
-
91
-
92
-
93
-
94
-
95
-
96
-
97
-
98
-
99
-
100
-
101
-
102
-
103
-
104
-
105
-
106
-
107
-
108
-
109
-
110
-
111
-
112
-
113
-
114
-
115
-
116
-
117
-
118
-
119
-
120
-
121
-
122
-
123
-
124
-
125
-
126
-
127
-
128
-
129
-
130
-
131
-
132
-
133
-
134
-
135
-
136
-
137
-
138
-
139
-
140
-
141
-
142
-
143
-
144
-
145
-
146
-
147
-
148
-
149
-
150
-
151
-
152
-
153
-
154
-
155
-
156
-
157
-
158
-
159
-
160
-
161
-
162
-
163
-
164
-
165
-
166
-
167
-
168
-
169
-
170
-
171
-
172
-
173
-
174
-
175
-
176
-
177
-
178
-
179
-
180
-
181
-
182
-
183
-
184
-
185
-
186
-
187
-
188
-
189
-
190
-
191
-
192
-
193
-
194
-
195
-
196
-
197
-
198
-
199
-
200
-
201
-
202
-
203
-
204
-
205
-
206
-
207
-
208
-
209
-
210
-
211
-
212
-
213
-
214
-
215
-
216
-
217
-
218
-
219
-
220
-
221
-
222
-
223
-
224
-
225
-
226
-
227
-
228
-
229
-
230
-
231
-
232
-
233
-
234
-
235
-
236
-
237
-
238
-
239
-
240
-
241
-
242
-
243
-
244
 |
 |

Philips Annual Report 200664
Key data
in millions of euros
20031) 20041) 2005
Sales 2,218 2,482 2,041
Sales growth
% increase (decrease), nominal
% increase (decrease), comparable
(25
(5
)
)
12
18
(18
(5
)
)
EBIT Corporate Technologies (293) (323) (219)
EBIT Corporate Investments (63) 35 (62)
EBIT Other 93 654 125
Total earnings before interest and tax
as a % of sales
(263
(11.9
)
)
366
14.7
(156
(7.6
)
)
Net operating capital (NOC) 150 117 272
Cash fl ows before fi nancing activities
(769) 741 2,584
Employees 27,086 23,869 19,050
(increased advertising and promotion). Sales growth
at Domestic Appliances was primarily attributable
to Food appliances, Garment Care and Floor Care.
Geographically, all regions contributed to the increased
sales with double-digit growth, most notably in Eastern
Europe, China and Latin America. Consumer Healthcare
Solutions reported sales of EUR 114 million, primarily
attributable to Lifeline Systems
.
In 2006, EBIT improved by EUR 28 million to EUR 386
million, mainly driven by increased sales. This result
included charges relating to the acquisition of Avent
(EUR 14 million) as well as a signifi cantly higher level
of advertising and promotional expenditure, to help
DAP sustain its high growth level.
EBIT of Consumer Healthcare Solutions included
acquisition-related charges for Lifeline Systems (EUR 12
million) and investments in research and development,
resulting in a loss of EUR 18 million in total.
The profi tability of DAP including Consumer Healthcare
Solutions declined from 16.3% in 2005 to 14.6%, mainly
due to acquisition-related costs (Avent, Lifeline) as well
as higher selling expenses (advertising and promotion)
and increased investments in research and development.
The EBIT margin of DAP excluding Consumer Healthcare
Solutions (transferred to Innovation & Emerging Businesses
as of January 1, 2007) amounted to 16.0%, at the upper
end of the 15-16% profi tability target.
The positive cash fl ows from operating activities of
EUR 547 million were more than offset by the cash
outfl ows of EUR 689 million and EUR 583 million for
the
acquisitions of Avent and Lifeline Systems respectively.
DAP plans to introduce a series of innovative products,
in particular in shaving and coffee-making, which will help
it achieve its comparable sales growth target of 7% and
EBITA of around 15% in 2007.
Leading industry awards
DAP won a number of eminent industry awards in 2006.
These included the Cannes Gold Cyber Lion award for
the division’s US Bodygroom web advertising campaign.
DAP Klagenfurt was presented with the Innovation &
Creativity Award by the Fraunhofer Institute’s Technology
Development Group. Leading lifestyle magazine Men’s
Health named SmartTouch-XL “Best New Electric Razor”
and Bodygroom “Best New Body Tool” as the fi rst
trimmer for below-the-belt shaving.
Sourcing
DAP’s supply strategy includes worldwide sourcing, use
of suppliers located in low-cost countries, dual sourcing
to avoid supply risk and ensure price competition,
a Supplier Relationship program, and early supplier
involvement in the product creation process.
Commodity products are leveraged through divisional
or Philips Group-level commodity purchasing teams.
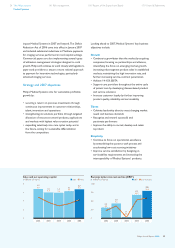
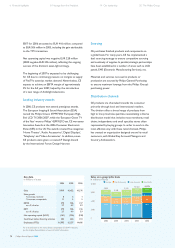
Key data
in millions of euros
2004 2005 2006
Sales 2,044 2,194 2,645
Sales growth
% increase (decrease), nominal (4) 7 21
% increase (decrease), comparable
(1) 6 11
EBITA 336 363 412
as a % of sales 16.4 16.5 15.6
EBIT 332 358 386
as a % of sales 16.2 16.3 14.6
Net operating capital (NOC) 393 370 1,758
Cash fl ows before fi nancing activities
393 418 (828)
Employees (FTEs) 8,205 8,203 10,953
For a reconciliation to the most directly comparable US GAAP measures,
see the chapter Reconciliation of non-US GAAP information
Philips Annual Report 200664
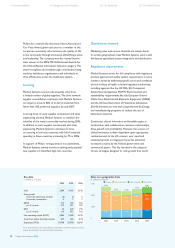
Sales on a geographic basis
in millions of euros
Europe North America LatinAmerica Asia Pacific
3,000
2,000
1,000
0
1,221
576
379
2002
2,273
1,201
524
319
2003
2,131
1,174
456
318
2004
2,044
1,247
460
366
2005
2,194
1,433
636
432
2006
2,645
97 87 96 121
144
6 Financial highlights 8 Message from the President 14 Our leadership 20 The Philips Group