Philips 2006 Annual Report Download - page 234
Download and view the complete annual report
Please find page 234 of the 2006 Philips annual report below. You can navigate through the pages in the report by either clicking on the pages listed below, or by using the keyword search tool below to find specific information within the annual report.-
 1
1 -
2
-
3
-
4
-
5
-
6
-
7
-
8
-
9
-
10
-
11
-
12
-
13
-
14
-
15
-
16
-
17
-
18
-
19
-
20
-
21
-
22
-
23
-
24
-
25
-
26
-
27
-
28
-
29
-
30
-
31
-
32
-
33
-
34
-
35
-
36
-
37
-
38
-
39
-
40
-
41
-
42
-
43
-
44
-
45
-
46
-
47
-
48
-
49
-
50
-
51
-
52
-
53
-
54
-
55
-
56
-
57
-
58
-
59
-
60
-
61
-
62
-
63
-
64
-
65
-
66
-
67
-
68
-
69
-
70
-
71
-
72
-
73
-
74
-
75
-
76
-
77
-
78
-
79
-
80
-
81
-
82
-
83
-
84
-
85
-
86
-
87
-
88
-
89
-
90
-
91
-
92
-
93
-
94
-
95
-
96
-
97
-
98
-
99
-
100
-
101
-
102
-
103
-
104
-
105
-
106
-
107
-
108
-
109
-
110
-
111
-
112
-
113
-
114
-
115
-
116
-
117
-
118
-
119
-
120
-
121
-
122
-
123
-
124
-
125
-
126
-
127
-
128
-
129
-
130
-
131
-
132
-
133
-
134
-
135
-
136
-
137
-
138
-
139
-
140
-
141
-
142
-
143
-
144
-
145
-
146
-
147
-
148
-
149
-
150
-
151
-
152
-
153
-
154
-
155
-
156
-
157
-
158
-
159
-
160
-
161
-
162
-
163
-
164
-
165
-
166
-
167
-
168
-
169
-
170
-
171
-
172
-
173
-
174
-
175
-
176
-
177
-
178
-
179
-
180
-
181
-
182
-
183
-
184
-
185
-
186
-
187
-
188
-
189
-
190
-
191
-
192
-
193
-
194
-
195
-
196
-
197
-
198
-
199
-
200
-
201
-
202
-
203
-
204
-
205
-
206
-
207
-
208
-
209
-
210
-
211
-
212
-
213
-
214
-
215
-
216
-
217
-
218
-
219
-
220
-
221
-
222
-
223
-
 224
224 -
 225
225 -
 226
226 -
 227
227 -
 228
228 -
 229
229 -
 230
230 -
 231
231 -
 232
232 -
 233
233 -
 234
234 -
 235
235 -
 236
236 -
 237
237 -
 238
238 -
 239
239 -
 240
240 -
 241
241 -
 242
242 -
 243
243 -
 244
244
 |
 |

Philips Annual Report 2006234
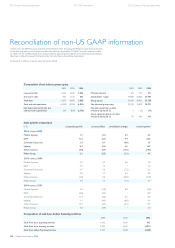
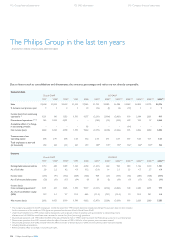
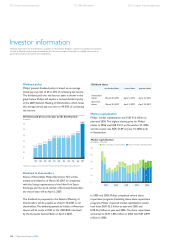
Due to factors such as consolidations and divestments, the amounts, percentages and ratios are not directly comparable.
General data
Dutch GAAP US GAAP
1997 1998
1) 1998
1) 1999 2000 2001
4) 2002
4) 2002
4)
5) 2003
4)
5) 2004
4)
5) 2005
4)
5) 2006
4)
5)
Sales 29,658 30,459 30,459 31,459 37,862 31,725 30,983 26,788 24,049 24,855 25,775 26,976
% increase over previous year 9 3 3 3 20 (16 ) (2 ) (2 ) (10 ) 3 4 5
Income (loss) from continuing
operations 2) 1,231 541 1,025 1,595 9,577 (2,331 ) (3,184 ) (2,863 ) 100 2,584 2,831 919
Discontinued operations 3) 4) 5) 263 5,054 4,891 − − (144 ) (22 ) (343 ) 609 252 37 4,464
Cumulative effect of a change
in accounting principle − − − − 85 − − − (14 ) − − −
Net income (loss) 2,602 6,053 5,900 1,590 9,662 (2,475 ) (3,206 ) (3,206 ) 695 2,836 2,868 5,383
Turnover rate of net
operating capital 2.84 2.91 2.95 3.20 3.12 2.15 2.41 3,07 3.67 4.56 4.71 3.35
Total employees at year-end
(in thousands) 252 234 234 227 219 189
6) 170
6) 170
6) 164
6) 162
6) 159
6) 122
Income
Dutch GAAP US GAAP
1997 1998
1) 1998
1) 1999 2000 2001
4) 2002
4) 2002
4)
5) 2003
4)
5) 2004
4)
5) 2005
4)
5) 2006
4)
5)
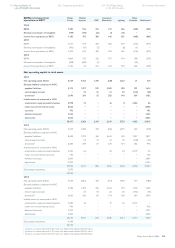
Earnings before interest and tax
1,714 685 1,289 1,553 4,258 (1,251 ) 442 943 830 1,156 1,472 1,183
As a % of sales 5.8 2.2 4.2 4.9 11.2 (3.9 ) 1.4 3.5 3.5 4.7 5.7 4.4
Income taxes (276 ) (41 ) (162 ) (208 ) (563 ) 428 (27 ) (133 ) (53 ) (230 ) (506 ) (137 )
As a % of income before taxes (20 ) (11 ) (17 ) (14 ) (9 ) 20 (2 ) (10 ) (9 ) (17 ) (32 ) (11 )
Income (loss)
from continuing operations7) 1,231 541 1,025 1,595 9,577 (2,331 ) (3,184 ) (2,863 ) 100 2,584 2,831 919
As a % of stock
holders’ equity
(ROE)
15.9 5.1 9.7 10.9 48.5 (11.2 ) (19.1 ) (15.3 ) 1.0 18.5 18.1 4.4
Net income (loss) 2,602 6,053 5,900 1,590 9,662 (2,475 ) (3,206 ) (3,206 ) 695 2,836 2,868 5,383
1) The Company has applied US GAAP since January 1, 2002. The years from 1998 onwards have been restated accordingly. Previous years have not been restated.
For the convenience of the reader the 1998 fi gures are presented on the basis of both US and Dutch GAAP.
2) Under Dutch GAAP, prior to 1999, certain material transactions, such as diposals of lines of activities, were accounted for as extraordinary items,
whereas under US GAAP, this would have been recorded in income (loss) from (continuing) operations.
3) Discontinued operations until 1998 refl ect the effect of the sale of PolyGram N.V. in 1998 in order to present the Philips Group accounts on a continuing basis.
4) Discontinued operations from 2001 onwards refl ect the effect of the sale of MDS in 2006, for which previous years have been restated.
5) Discontinued operations from 2002 onwards refl ect the effect of the sale of Semiconductors in 2006, for which previous years have been restated.
6) Including discontinued operations.
7) Before cumulative effect of a change in accounting principles.
The Philips Group in the last ten years
all amounts in millions of euros unless otherwise stated
112 Group fi nancial statements 172 IFRS information 218 Company fi nancial statements