Philips 2006 Annual Report Download - page 235
Download and view the complete annual report
Please find page 235 of the 2006 Philips annual report below. You can navigate through the pages in the report by either clicking on the pages listed below, or by using the keyword search tool below to find specific information within the annual report.-
 1
1 -
2
-
3
-
4
-
5
-
6
-
7
-
8
-
9
-
10
-
11
-
12
-
13
-
14
-
15
-
16
-
17
-
18
-
19
-
20
-
21
-
22
-
23
-
24
-
25
-
26
-
27
-
28
-
29
-
30
-
31
-
32
-
33
-
34
-
35
-
36
-
37
-
38
-
39
-
40
-
41
-
42
-
43
-
44
-
45
-
46
-
47
-
48
-
49
-
50
-
51
-
52
-
53
-
54
-
55
-
56
-
57
-
58
-
59
-
60
-
61
-
62
-
63
-
64
-
65
-
66
-
67
-
68
-
69
-
70
-
71
-
72
-
73
-
74
-
75
-
76
-
77
-
78
-
79
-
80
-
81
-
82
-
83
-
84
-
85
-
86
-
87
-
88
-
89
-
90
-
91
-
92
-
93
-
94
-
95
-
96
-
97
-
98
-
99
-
100
-
101
-
102
-
103
-
104
-
105
-
106
-
107
-
108
-
109
-
110
-
111
-
112
-
113
-
114
-
115
-
116
-
117
-
118
-
119
-
120
-
121
-
122
-
123
-
124
-
125
-
126
-
127
-
128
-
129
-
130
-
131
-
132
-
133
-
134
-
135
-
136
-
137
-
138
-
139
-
140
-
141
-
142
-
143
-
144
-
145
-
146
-
147
-
148
-
149
-
150
-
151
-
152
-
153
-
154
-
155
-
156
-
157
-
158
-
159
-
160
-
161
-
162
-
163
-
164
-
165
-
166
-
167
-
168
-
169
-
170
-
171
-
172
-
173
-
174
-
175
-
176
-
177
-
178
-
179
-
180
-
181
-
182
-
183
-
184
-
185
-
186
-
187
-
188
-
189
-
190
-
191
-
192
-
193
-
194
-
195
-
196
-
197
-
198
-
199
-
200
-
201
-
202
-
203
-
204
-
205
-
206
-
207
-
208
-
209
-
210
-
211
-
212
-
213
-
214
-
215
-
216
-
217
-
218
-
219
-
220
-
221
-
222
-
223
-
224
-
 225
225 -
 226
226 -
 227
227 -
 228
228 -
 229
229 -
 230
230 -
 231
231 -
 232
232 -
 233
233 -
 234
234 -
 235
235 -
 236
236 -
 237
237 -
 238
238 -
 239
239 -
 240
240 -
 241
241 -
 242
242 -
 243
243 -
 244
244
 |
 |

Philips Annual Report 2006 235
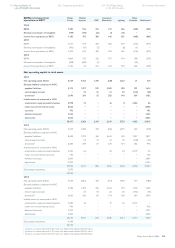
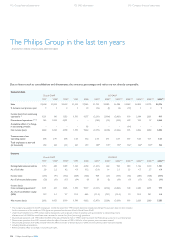
Capital employed
Dutch GAAP US GAAP
1997 1998
1) 1998
1) 1999 2000 2001
4) 2002
4) 2002
4)
5) 2003
4)
5) 2004
4)
5) 2005
4)
5) 2006
4)
5)
Cash and cash equivalents 1,397 6,553 6,553 2,331 1,089 890 1,858 1,858 3,072 4,349 5,293 6,023
Receivables and other current assets 5,464 5,442 5,442 6,453 6,806 6,540 5,479 4,906 4,510 5,096 5,532 6,059
Assets of discontinued operations 1,482 − − − − 426 452 7,381 5,774 4,198 3,973 −
Inventories 4,522 4,274 4,017 4,268 5,279 4,240 3,449 2,817 2,468 2,500 2,797 2,880
Non-current fi nancial assets/
equity-accounted investees 1,451 2,836 2,871 7,400 11,306 11,033 7,395 4,995 4,100 6,240 6,072 11,034
Non-current receivables/assets 1,858 1,920 1,920 2,326 2,713 3,080 2,772 2,823 2,792 3,040 3,444 3,667
Property, plant and equipment 6,935 6,574 6,597 7,332 9,041 7,474 5,950 3,001 2,872 2,792 3,019 3,099
Intangible assets 213 554 609 1,563 3,290 5,519 4,934 4,424 3,401 2,524 3,775 5,735
Total assets 23,322 28,153 28,009 31,673 39,524 39,202 32,289 32,205 28,989 30,739 33,905 38,497
Property, plant and equipment:
Capital expenditures for the year
1,627 1,634 1,634 1,662 3,170 2,069 1,141 720 679 673 644 703
Depreciation for the year 1,492 1,615 1,615 1,548 1,789 1,908 1,732 795 658 650 556 564
Capital expenditures :
depreciation 1.1 1.0 1.0 1.1 1.8 1.1 0.7 0.9 1.0 1.0 1.2 1.2
Inventories as a % of sales 15.2 14.0 13.2 13.6 13.9 13.4 11.1 10.7 10.3 10.1 10.9 10.7
Outstanding trade receivables,
in months’ sales 1.3 1.3 1.3 1.4 1.5 1,5 1.3 1.3 1.3 1.3 1.4 1.5
Financial structure
Dutch GAAP US GAAP
1997 1998
1) 1998
1) 1999 2000 2001
4) 2002
4) 2002
4)
5) 2003
4)
5) 2004
4)
5) 2005
4)
5) 2006
4)
5)
Other liabilities 6,328 6,779 6,751 8,262 8,764 8,047 7,573 6,854 6,339 7,188 8,498 8,175
Liabilities of discontinued operations - - - - - 196 264 1,166 1,146 1,346 1,385 −
Debt 4,030 3,587 3,587 3,314 4,027 7,866 7,109 7,109 5,876 4,513 4,487 3,869
Provisions 3,251 2,985 2,973 3,056 3,557 3,731 3,245 2,978 2,690 2,673 2,710 3,325
Total provisions and liabilities 13,609 13,351 13,311 14,632 16,348 19,840 18,191 18,107 16,051 15,720 17,080 15,369
Minority interests 559 242 242 333 469 202 179 179 175 159 159 131
Stockholders’ equity 9,154 14,560 14,456 16,708 22,707 19,160 13,919 13,919 12,763 14,860 16,666 22,997
Total equity and liabilities 23,322 28,153 28,009 31,673 39,524 39,202 32,289 32,205 28,989 30,739 33,905 38,497
Net debt: group equity ratio 21:79 ( 25):125
(25):125
5:95 11:89 26:74 27:73 27:73 18:82 1:99 (5):105 (10):110
Market capitalization at year-end 19,759 20,631 20,631 44,942 50,098 42,532 21,309 21,309 29,648 25,003 31,536 31,624
Key fi gures per share
Dutch GAAP US GAAP
1997 1998
1) 1998
1) 1999 2000 2001
4) 2002
4) 2002
4)
5) 2003
4)
5) 2004
4)
5) 2005
4)
5) 2006
4)
5)
Sales per common share 21.22 21.15 21.15 22.83 28.84 24.82 24.30 21.01 18.83 19.41 20.62 22.96
Income from continuing operations per share 0.88 0.38 0.71 1.16 7.29 (1.82 ) (2.50 ) (2.25 ) 0.08 2.02 2.26 0.78
Dividend paid per common share 0.18 0.23 0.23 0.25 0.30 0.36 0.36 0.36 0.36 0.36 0.40 0.44
Total shareholder return per common share 5.75 0.73 0.73 19.70 5.57 (5.28 ) (16.32 ) (16.32 ) 6.81 (3.28 ) 7.14 2.76
Stockholders’ equity per common share 6.39 10.09 10.02 12.55 17.69 15.04 10.91 10.91 9.97 11.60 13.87 20.78
Price/Earnings ratio 15.67 38.07 20.09 29.16 5.35 (18.30 ) (6.69 ) (7.74 ) 295.67 9.67 11.59 36.53
Share price at year-end 13.80 14.30 14.30 33.75 39.02 33.38 16.70 16.70 23.15 19.51 26.25 28.57
Highest share price during the year 21.04 24.04 24.04 33.90 57.25 44.20 35.40 35.40 24.86 26.20 26.70 29.31
Lowest share price during the year 7.99 9.37 9.37 14.66 31.21 18.03 13.25 13.25 12.65 17.89 18.53 21.89
Average share price 14.42 17.06 17.06 22.77 46.37 31.66 25.58 25.58 18.79 21.45 21.59 26.57
Common shares outstanding at year-end 1,432 1,443 1,443 1,332 1,284 1,274 1,276 1,276 1,281 1,282 1,201 1,107
Weighted average shares outstanding basic 1,398 1,440 1,440 1,378 1,313 1,278 1,275 1,275 1,277 1,280 1,250 1,175
Weighted average shares outstanding diluted 1,425 1,452 1,452 1,389 1,327 1,287 1,279 1,279 1,281 1,284 1,253 1,183
226 Corporate governance224 Reconciliation of
non-US GAAP information
234 The Philips Group
in the last ten years
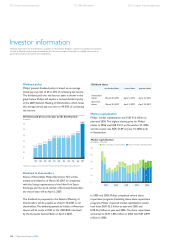
236 Investor information