Philips 2006 Annual Report Download - page 150
Download and view the complete annual report
Please find page 150 of the 2006 Philips annual report below. You can navigate through the pages in the report by either clicking on the pages listed below, or by using the keyword search tool below to find specific information within the annual report.-
 1
1 -
2
-
3
-
4
-
5
-
6
-
7
-
8
-
9
-
10
-
11
-
12
-
13
-
14
-
15
-
16
-
17
-
18
-
19
-
20
-
21
-
22
-
23
-
24
-
25
-
26
-
27
-
28
-
29
-
30
-
31
-
32
-
33
-
34
-
35
-
36
-
37
-
38
-
39
-
40
-
41
-
42
-
43
-
44
-
45
-
46
-
47
-
48
-
49
-
50
-
51
-
52
-
53
-
54
-
55
-
56
-
57
-
58
-
59
-
60
-
61
-
62
-
63
-
64
-
65
-
66
-
67
-
68
-
69
-
70
-
71
-
72
-
73
-
74
-
75
-
76
-
77
-
78
-
79
-
80
-
81
-
82
-
83
-
84
-
85
-
86
-
87
-
88
-
89
-
90
-
91
-
92
-
93
-
94
-
95
-
96
-
97
-
98
-
99
-
100
-
101
-
102
-
103
-
104
-
105
-
106
-
107
-
108
-
109
-
110
-
111
-
112
-
113
-
114
-
115
-
116
-
117
-
118
-
119
-
120
-
121
-
122
-
123
-
124
-
125
-
126
-
127
-
128
-
129
-
130
-
131
-
132
-
133
-
134
-
135
-
136
-
137
-
138
-
139
-
 140
140 -
 141
141 -
 142
142 -
 143
143 -
 144
144 -
 145
145 -
 146
146 -
 147
147 -
 148
148 -
 149
149 -
 150
150 -
 151
151 -
 152
152 -
 153
153 -
 154
154 -
 155
155 -
 156
156 -
 157
157 -
 158
158 -
 159
159 -
 160
160 -
161
-
162
-
163
-
164
-
165
-
166
-
167
-
168
-
169
-
170
-
171
-
172
-
173
-
174
-
175
-
176
-
177
-
178
-
179
-
180
-
181
-
182
-
183
-
184
-
185
-
186
-
187
-
188
-
189
-
190
-
191
-
192
-
193
-
194
-
195
-
196
-
197
-
198
-
199
-
200
-
201
-
202
-
203
-
204
-
205
-
206
-
207
-
208
-
209
-
210
-
211
-
212
-
213
-
214
-
215
-
216
-
217
-
218
-
219
-
220
-
221
-
222
-
223
-
224
-
225
-
226
-
227
-
228
-
229
-
230
-
231
-
232
-
233
-
234
-
235
-
236
-
237
-
238
-
239
-
240
-
241
-
242
-
243
-
244
 |
 |

Philips Annual Report 2006150
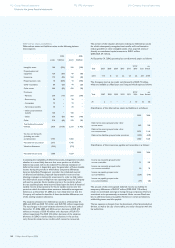
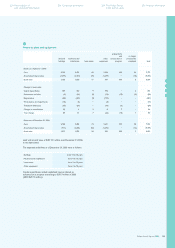
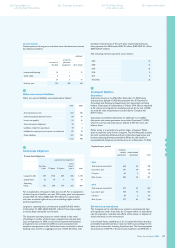
2005 2006
Netherlands other total Netherlands other total
Amounts recognized in the consolidated balance sheet
Prepaid pension costs under other non-current assets 1,366 310 1,676 2,143 119 2,262
Accrued pension costs under other non-current liabilities − (665 ) (665 ) − (442 ) (442 )
Provisions for pensions under provisions including
discontinued operations (23 ) (976 ) (999 ) (18 ) (860 ) (878 )
Net pension asset/(liability) at year end 1,343 (1,331 ) 12 2,125 (1,183 ) 942
Amounts recognized in accumulated other
comprehensive income (before tax)
Net actuarial loss − − − 273 1,301 1,574
Prior-service cost (credit) − − − (464 ) 52 (412 )
Additional minimum pension liability − 844 844 − − −
Accumulated other comprehensive income − 844 844 (191 ) 1,353 1,162
In 2005, the Company recorded an additional minimum pension liability (AML) of EUR 930 million. In conjunction with
the recording of the AML, an intangible asset of EUR 86 million and a EUR 844 million change to other comprehensive
income (prior to tax benefi t) was also recorded.
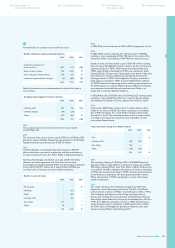
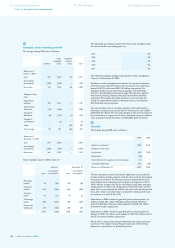
The following table provides a reconciliation of the funded status to the amounts recognized on the Consolidated
balance sheet at December 31, 2005.
2005
Netherlands other total
Funded status 1,555 (1,859 ) (304 )
Amounts not recognized in balance sheet:
Unrecognized net transition obligation − 2 2
Unrecognized prior-service cost (702 ) 89 (613 )
Unrecognized net loss 490 1,367 1,857
Less: additional minimum pension liability recognized − (844 ) (844 )
Net unrecognized amount (212 ) 614 402
Amount recognized on balance sheet 1,343 (1,245 ) 98
Classifi cation of net balances:
Net pension asset (liability) 1,343 (1,331 ) 12
Intangible asset − 86 86
1,343 (1,245 ) 98
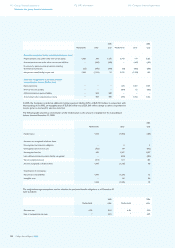
The weighted average assumptions used to calculate the projected benefi t obligations as of December 31
were as follows:
2005 2006
Netherlands other Netherlands other
Discount rate 4.2% 5.1% 4.3% 5.2%
Rate of compensation increase * 3.4% * 3.5%
112 Group fi nancial statements
Notes to the group fi nancial statements
172 IFRS information 218 Company fi nancial statements