Philips 2006 Annual Report Download - page 130
Download and view the complete annual report
Please find page 130 of the 2006 Philips annual report below. You can navigate through the pages in the report by either clicking on the pages listed below, or by using the keyword search tool below to find specific information within the annual report.-
 1
1 -
2
-
3
-
4
-
5
-
6
-
7
-
8
-
9
-
10
-
11
-
12
-
13
-
14
-
15
-
16
-
17
-
18
-
19
-
20
-
21
-
22
-
23
-
24
-
25
-
26
-
27
-
28
-
29
-
30
-
31
-
32
-
33
-
34
-
35
-
36
-
37
-
38
-
39
-
40
-
41
-
42
-
43
-
44
-
45
-
46
-
47
-
48
-
49
-
50
-
51
-
52
-
53
-
54
-
55
-
56
-
57
-
58
-
59
-
60
-
61
-
62
-
63
-
64
-
65
-
66
-
67
-
68
-
69
-
70
-
71
-
72
-
73
-
74
-
75
-
76
-
77
-
78
-
79
-
80
-
81
-
82
-
83
-
84
-
85
-
86
-
87
-
88
-
89
-
90
-
91
-
92
-
93
-
94
-
95
-
96
-
97
-
98
-
99
-
100
-
101
-
102
-
103
-
104
-
105
-
106
-
107
-
108
-
109
-
110
-
111
-
112
-
113
-
114
-
115
-
116
-
117
-
118
-
119
-
 120
120 -
 121
121 -
 122
122 -
 123
123 -
 124
124 -
 125
125 -
 126
126 -
 127
127 -
 128
128 -
 129
129 -
 130
130 -
 131
131 -
 132
132 -
 133
133 -
 134
134 -
 135
135 -
 136
136 -
 137
137 -
 138
138 -
 139
139 -
 140
140 -
141
-
142
-
143
-
144
-
145
-
146
-
147
-
148
-
149
-
150
-
151
-
152
-
153
-
154
-
155
-
156
-
157
-
158
-
159
-
160
-
161
-
162
-
163
-
164
-
165
-
166
-
167
-
168
-
169
-
170
-
171
-
172
-
173
-
174
-
175
-
176
-
177
-
178
-
179
-
180
-
181
-
182
-
183
-
184
-
185
-
186
-
187
-
188
-
189
-
190
-
191
-
192
-
193
-
194
-
195
-
196
-
197
-
198
-
199
-
200
-
201
-
202
-
203
-
204
-
205
-
206
-
207
-
208
-
209
-
210
-
211
-
212
-
213
-
214
-
215
-
216
-
217
-
218
-
219
-
220
-
221
-
222
-
223
-
224
-
225
-
226
-
227
-
228
-
229
-
230
-
231
-
232
-
233
-
234
-
235
-
236
-
237
-
238
-
239
-
240
-
241
-
242
-
243
-
244
 |
 |

Philips Annual Report 2006130
1
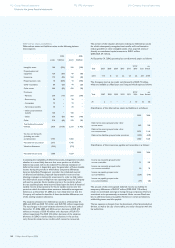
Discontinued operations
Semiconductors
On September 29, 2006, the Company sold a majority stake in its
Semiconductors division to a private equity consortium led by Kohlberg
Kravis Robert & Co. (KKR). The transaction consisted of the sale
of the division for a total consideration of EUR 7,913 million and
a simultaneous acquisition of a minority interest in the recapitalized
organization at a cost of EUR 854 million. A gain of EUR 4,283 million
was recorded on the sale, net of costs directly associated with this
transaction of approximately EUR 367 million. The recorded income
tax expense on this gain is still under discussion with the tax authorities.
In accordance with SFAS No. 144 ‘Accounting for the Impairment or
Disposal of Long-Lived Assets’, the operations of the Semiconductors
division and the aforementioned gain have been presented as
discontinued operations. Prior-year consolidated fi nancial statements
have been restated to conform to this presentation.
The Company’s ownership interest in the recapitalized organization, now
named NXP Semiconductors, was recorded initially at its fair value as at
the date of the transaction of EUR 854 million. Philips’ ownership in NXP
consists of 19.9% of the preferred shares and 17.5% of the common
shares. The Company has determined that they cannot exert signifi cant
infl uence over the operating or fi nancial policies of NXP and accordingly
the investment is accounted for as a cost-method investment.
Philips and NXP will have continuing relationships through shared
research and development activities and through license agreements.
The existing global service agreements for – amongst others – payroll,
network and purchase facilities cover a period of approximately
one year. Additionally, through the purchase of component products,
namely semiconductor products for the consumer electronic sector,
Philips and NXP will have a continuing relationship for the foreseeable
future. The Company has assessed the expected future transactions
and determined that the cash fl ows from these transactions are not
signifi cant direct cash fl ows.
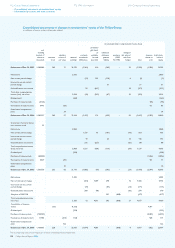
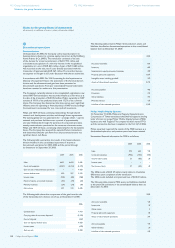
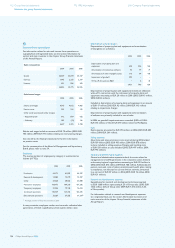
The following table summarizes the results of the Semiconductors
division included in the consolidated statement of income as
discontinued operations for 2004, 2005 and the period through
its divestment on September 29, 2006.
2004 2005 2006
Sales 4,491 4,620 3,681
Costs and expenses (4,061 ) (4,313 ) (3,319 )
Gain on sale of discontinued operations − − 4,953
Income before taxes 430 307 5,315
Income taxes (128 ) (80 ) (768 )
Result of equity- accounted investees (42 ) (73 ) (63 )
Minority interests (29 ) (34 ) (49 )
Net income 231 120 4,435
The following table shows the components of the gain from the sale
of the Semiconductors division, net of tax on December 31, 2006:
2006
Consideration 7,913
Carrying value of net assets disposed (2,593 )
Cost of disposal (367 )
Gain on disposal before taxes 4,953
Income taxes (670 )
Gain on sale 4,283
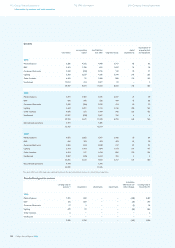
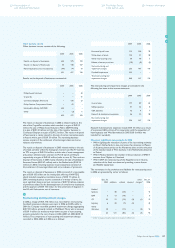
The following table presents Philips’ Semiconductors assets and
liabilities, classifi ed as discontinued operations in the consolidated
balance sheet at December 31, 2005:
2005
Accounts receivable 604
Inventory 683
Investments in equity-accounted investees 299
Property, plant and equipment 1,874
Intangible assets including goodwill 272
Assets of discontinued operations 3,732
Accounts payables 443
Provisions 215
Other liabilities 411
Minority interest 173
Liabilities of discontinued operations 1,242
Philips Mobile Display Systems
On November 10, 2005, Philips and Toppoly Optoelectronics
Corporation of Taiwan announced that they had signed a binding
letter of intent to merge Philips’ Mobile Display Systems (MDS)
business unit with Toppoly. The company has been named TPO,
and the transaction has been completed in the fi rst half of 2006.
Philips separately reported the results of the MDS business as a
discontinued operation, and previous years have been restated.
Summarized fi nancial information for MDS is as follows:
2004 2005 2006
Sales 973 653 194
Costs and expenses (952 ) (736 ) (165 )
Income before taxes 21 (83 ) 29
Income taxes − − −
Net income (loss) 21 (83 ) 29
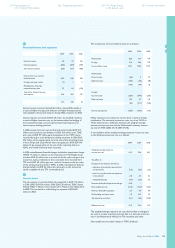
The 2006 results of EUR 29 million mainly relate to translation
differences upon completion of the transaction.
The 2005 results included an impairment loss of EUR 69 million.
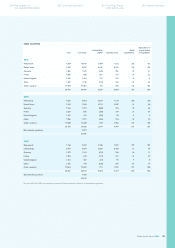
The following table presents MDS assets and liabilities, classifi ed
as discontinued operations in the consolidated balance sheet at
December 31, 2005:
2005
Accounts receivable 135
Inventories 37
Other assets 5
Property, plant and equipment 64
Assets of discontinued operations 241
Accounts payable 114
Other liabilities 29
Liabilities of discontinued operations 143
Notes to the group fi nancial statements
all amounts in millions of euros unless otherwise stated
112 Group fi nancial statements
Notes to the group fi nancial statements
172 IFRS information 218 Company fi nancial statements