Philips 2006 Annual Report Download - page 151
Download and view the complete annual report
Please find page 151 of the 2006 Philips annual report below. You can navigate through the pages in the report by either clicking on the pages listed below, or by using the keyword search tool below to find specific information within the annual report.-
 1
1 -
2
-
3
-
4
-
5
-
6
-
7
-
8
-
9
-
10
-
11
-
12
-
13
-
14
-
15
-
16
-
17
-
18
-
19
-
20
-
21
-
22
-
23
-
24
-
25
-
26
-
27
-
28
-
29
-
30
-
31
-
32
-
33
-
34
-
35
-
36
-
37
-
38
-
39
-
40
-
41
-
42
-
43
-
44
-
45
-
46
-
47
-
48
-
49
-
50
-
51
-
52
-
53
-
54
-
55
-
56
-
57
-
58
-
59
-
60
-
61
-
62
-
63
-
64
-
65
-
66
-
67
-
68
-
69
-
70
-
71
-
72
-
73
-
74
-
75
-
76
-
77
-
78
-
79
-
80
-
81
-
82
-
83
-
84
-
85
-
86
-
87
-
88
-
89
-
90
-
91
-
92
-
93
-
94
-
95
-
96
-
97
-
98
-
99
-
100
-
101
-
102
-
103
-
104
-
105
-
106
-
107
-
108
-
109
-
110
-
111
-
112
-
113
-
114
-
115
-
116
-
117
-
118
-
119
-
120
-
121
-
122
-
123
-
124
-
125
-
126
-
127
-
128
-
129
-
130
-
131
-
132
-
133
-
134
-
135
-
136
-
137
-
138
-
139
-
140
-
 141
141 -
 142
142 -
 143
143 -
 144
144 -
 145
145 -
 146
146 -
 147
147 -
 148
148 -
 149
149 -
 150
150 -
 151
151 -
 152
152 -
 153
153 -
 154
154 -
 155
155 -
 156
156 -
 157
157 -
 158
158 -
 159
159 -
 160
160 -
 161
161 -
162
-
163
-
164
-
165
-
166
-
167
-
168
-
169
-
170
-
171
-
172
-
173
-
174
-
175
-
176
-
177
-
178
-
179
-
180
-
181
-
182
-
183
-
184
-
185
-
186
-
187
-
188
-
189
-
190
-
191
-
192
-
193
-
194
-
195
-
196
-
197
-
198
-
199
-
200
-
201
-
202
-
203
-
204
-
205
-
206
-
207
-
208
-
209
-
210
-
211
-
212
-
213
-
214
-
215
-
216
-
217
-
218
-
219
-
220
-
221
-
222
-
223
-
224
-
225
-
226
-
227
-
228
-
229
-
230
-
231
-
232
-
233
-
234
-
235
-
236
-
237
-
238
-
239
-
240
-
241
-
242
-
243
-
244
 |
 |

Philips Annual Report 2006 151
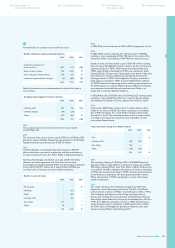
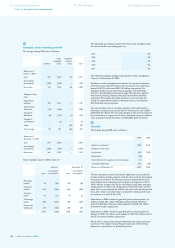
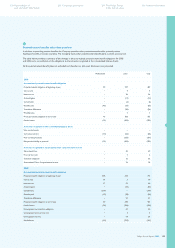
The weighted-average assumptions used to calculate the net periodic pension cost for the years ended December 31 were as follows:
2005 2006
Netherlands other Netherlands other
Discount rate 4.5% 5.4% 4.2% 5.1%
Expected returns on plans assets 5.7% 6.5% 5.7% 6.1%
Rate of compensation increase * 3.5% * 3.4%
* The rate of compensation increase for the Netherlands consists of a general compensation increase and an individual salary increase based on merit, seniority and
promotion. The average individual salary increase for all active participants for the remaining working lifetime is estimated at 0.75% annually. The assumed rate of general
compensation increase for the Netherlands for calculating the projected benefi t obligations amounts to 2% until 2008. From 2008 onwards a rate of compensation
increase of 1% is assumed. The difference refl ects a change in indexation policy.
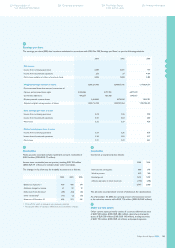
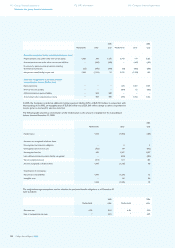
The components of net periodic pension costs and other amounts recognized in Other comprehensive income were as follows:
Netherlands other
2006
Service cost 198 129
Interest cost on the projected benefi t obligation 531 411
Expected return on plan assets (808 ) (390 )
Net amortization of unrecognized net transition assets/liabilities − 1
Net actuarial (gain) loss recognized (49 ) 84
Amortization of prior-service cost (56 ) 25
Settlement loss 8 2
Curtailment gain (21 ) (1 )
Other 5 23
Net periodic cost (income)
1) (192 ) 284
2005
Service cost 211 132
Interest cost on the projected benefi t obligation 557 392
Expected return on plan assets (739 ) (360 )
Net amortization of unrecognized net transition assets/liabilities − 1
Net actuarial (gain) loss recognized (28 ) 44
Amortization of prior-service cost (57 ) 27
Settlement loss − 12
Curtailment loss − −
Other (4 ) (1 )
Net periodic cost (income)
2) (60 ) 247
2004
Service cost 175 128
Interest cost on the projected benefi t obligation 598 386
Expected return on plan assets (726 ) (370 )
Net amortization of unrecognized net transition assets/liabilities − 5
Net actuarial (gain) loss recognized (1 ) 19
Amortization of prior-service cost (43 ) 26
Settlement loss 34 3
Curtailment loss − −
Other (12 ) 7
Net periodic cost
3) 25 204
1) of which EUR 17 million (Netherlands EUR (12) million, other EUR 29 million) is related to discontinued operations
2) of which EUR 30 million (Netherlands EUR (5) million, other EUR 35 million) is related to discontinued operations
3) of which EUR 38 million (other EUR 38 million) is related to discontinued operations
226 Corporate governance224 Reconciliation of
non-US GAAP information
234 The Philips Group
in the last ten years
236 Investor information