Philips 2006 Annual Report Download - page 143
Download and view the complete annual report
Please find page 143 of the 2006 Philips annual report below. You can navigate through the pages in the report by either clicking on the pages listed below, or by using the keyword search tool below to find specific information within the annual report.-
 1
1 -
2
-
3
-
4
-
5
-
6
-
7
-
8
-
9
-
10
-
11
-
12
-
13
-
14
-
15
-
16
-
17
-
18
-
19
-
20
-
21
-
22
-
23
-
24
-
25
-
26
-
27
-
28
-
29
-
30
-
31
-
32
-
33
-
34
-
35
-
36
-
37
-
38
-
39
-
40
-
41
-
42
-
43
-
44
-
45
-
46
-
47
-
48
-
49
-
50
-
51
-
52
-
53
-
54
-
55
-
56
-
57
-
58
-
59
-
60
-
61
-
62
-
63
-
64
-
65
-
66
-
67
-
68
-
69
-
70
-
71
-
72
-
73
-
74
-
75
-
76
-
77
-
78
-
79
-
80
-
81
-
82
-
83
-
84
-
85
-
86
-
87
-
88
-
89
-
90
-
91
-
92
-
93
-
94
-
95
-
96
-
97
-
98
-
99
-
100
-
101
-
102
-
103
-
104
-
105
-
106
-
107
-
108
-
109
-
110
-
111
-
112
-
113
-
114
-
115
-
116
-
117
-
118
-
119
-
120
-
121
-
122
-
123
-
124
-
125
-
126
-
127
-
128
-
129
-
130
-
131
-
132
-
 133
133 -
 134
134 -
 135
135 -
 136
136 -
 137
137 -
 138
138 -
 139
139 -
 140
140 -
 141
141 -
 142
142 -
 143
143 -
 144
144 -
 145
145 -
 146
146 -
 147
147 -
 148
148 -
 149
149 -
 150
150 -
 151
151 -
 152
152 -
 153
153 -
154
-
155
-
156
-
157
-
158
-
159
-
160
-
161
-
162
-
163
-
164
-
165
-
166
-
167
-
168
-
169
-
170
-
171
-
172
-
173
-
174
-
175
-
176
-
177
-
178
-
179
-
180
-
181
-
182
-
183
-
184
-
185
-
186
-
187
-
188
-
189
-
190
-
191
-
192
-
193
-
194
-
195
-
196
-
197
-
198
-
199
-
200
-
201
-
202
-
203
-
204
-
205
-
206
-
207
-
208
-
209
-
210
-
211
-
212
-
213
-
214
-
215
-
216
-
217
-
218
-
219
-
220
-
221
-
222
-
223
-
224
-
225
-
226
-
227
-
228
-
229
-
230
-
231
-
232
-
233
-
234
-
235
-
236
-
237
-
238
-
239
-
240
-
241
-
242
-
243
-
244
 |
 |

Philips Annual Report 2006 143
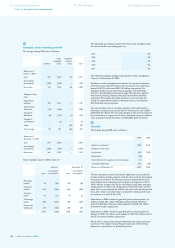
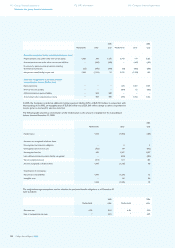
88
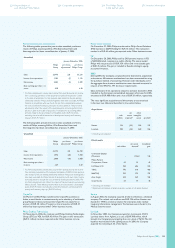
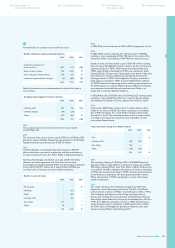
Earnings per share
The earnings per share (EPS) data have been calculated in accordance with SFAS No. 128, ‘Earnings per Share’, as per the following schedule:
2004 2005 2006
Net income
Income from continuing operations 2,584 2,831 919
Income from discontinued operations 252 37 4,464
Net income available to holders of common shares 2,836 2,868 5,383
Weighted average number of shares 1,280,251,485 1,249,955,546 1,174,924,579
Plus incremental share from assumed conversions of:
Options and restricted share rights 2,968,386 2,771,955 6,817,690
Convertible debentures 496,257 602,863 1,042,061
Dilutive potential common shares 3,464,643 3,374,818 7,859,751
Adjusted weighted average number of shares 1,283,716,128 1,253,330,364 1,182,784,330
Basic earnings per share in euros
Income from continuing operations 2.02 2.26 0.78
Income from discontinued operations 0.20 0.03 3.80
Net income 2.22 2.29 4.58
Diluted earnings per share in euros
Income from continuing operations 2.01 2.26 0.78
Income from discontinued operations 0.20 0.03 3.77
Net income 2.21 2.29 4.55
88
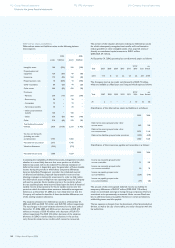
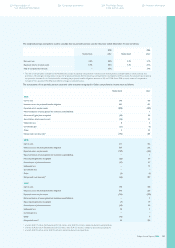
9
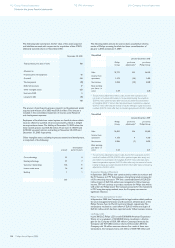
Receivables
Trade accounts receivable include installment accounts receivable of
EUR 8 million (2005: EUR 17 million).
Income taxes receivable (current portion) totaling EUR 105 million
(2005: EUR 71 million) are included under other receivables.
The changes in the allowance for doubtful accounts are as follows:
2004 2005 2006
Balance as of January 1 428 408 374
Additions charged to income 61 30 52
Deductions from allowance
1) (68 ) (62 ) (72 )
Other movements
2) (13 ) (2 ) (13 )
Balance as of December 31 408 374 341
1) Write-offs for which an allowance was previously provided
2) Including the effect of translation differences and consolidation changes
99
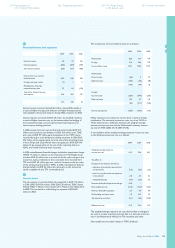
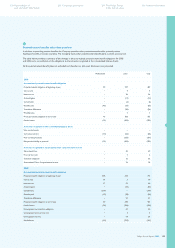
10
Inventories
Inventories are summarized as follows:
2005 2006
Raw materials and supplies 889 849
Work in process 472 380
Finished goods 1,612 1,859
Advance payments on work in process (176 ) (208 )
2,797 2,880
The amounts recorded above are net of allowances for obsolescence.
As of December 31, 2006, the carrying amount of inventories carried
at fair value less cost-to-sell is EUR 116 million (2005: EUR 89 million).
11
Other current assets
Other current assets primarily consist of a current deferred tax asset
of EUR 508 million (2005: EUR 482 million), derivative instruments
assets of EUR 298 million (2005: EUR 143 million), trading securities
of EUR 192 million (2005: EUR nil million) and prepaid expenses.
1010
1111
226 Corporate governance224 Reconciliation of
non-US GAAP information
234 The Philips Group
in the last ten years
236 Investor information