Philips 2006 Annual Report Download - page 209
Download and view the complete annual report
Please find page 209 of the 2006 Philips annual report below. You can navigate through the pages in the report by either clicking on the pages listed below, or by using the keyword search tool below to find specific information within the annual report.-
 1
1 -
2
-
3
-
4
-
5
-
6
-
7
-
8
-
9
-
10
-
11
-
12
-
13
-
14
-
15
-
16
-
17
-
18
-
19
-
20
-
21
-
22
-
23
-
24
-
25
-
26
-
27
-
28
-
29
-
30
-
31
-
32
-
33
-
34
-
35
-
36
-
37
-
38
-
39
-
40
-
41
-
42
-
43
-
44
-
45
-
46
-
47
-
48
-
49
-
50
-
51
-
52
-
53
-
54
-
55
-
56
-
57
-
58
-
59
-
60
-
61
-
62
-
63
-
64
-
65
-
66
-
67
-
68
-
69
-
70
-
71
-
72
-
73
-
74
-
75
-
76
-
77
-
78
-
79
-
80
-
81
-
82
-
83
-
84
-
85
-
86
-
87
-
88
-
89
-
90
-
91
-
92
-
93
-
94
-
95
-
96
-
97
-
98
-
99
-
100
-
101
-
102
-
103
-
104
-
105
-
106
-
107
-
108
-
109
-
110
-
111
-
112
-
113
-
114
-
115
-
116
-
117
-
118
-
119
-
120
-
121
-
122
-
123
-
124
-
125
-
126
-
127
-
128
-
129
-
130
-
131
-
132
-
133
-
134
-
135
-
136
-
137
-
138
-
139
-
140
-
141
-
142
-
143
-
144
-
145
-
146
-
147
-
148
-
149
-
150
-
151
-
152
-
153
-
154
-
155
-
156
-
157
-
158
-
159
-
160
-
161
-
162
-
163
-
164
-
165
-
166
-
167
-
168
-
169
-
170
-
171
-
172
-
173
-
174
-
175
-
176
-
177
-
178
-
179
-
180
-
181
-
182
-
183
-
184
-
185
-
186
-
187
-
188
-
189
-
190
-
191
-
192
-
193
-
194
-
195
-
196
-
197
-
198
-
 199
199 -
 200
200 -
 201
201 -
 202
202 -
 203
203 -
 204
204 -
 205
205 -
 206
206 -
 207
207 -
 208
208 -
 209
209 -
 210
210 -
 211
211 -
 212
212 -
 213
213 -
 214
214 -
 215
215 -
 216
216 -
 217
217 -
 218
218 -
 219
219 -
220
-
221
-
222
-
223
-
224
-
225
-
226
-
227
-
228
-
229
-
230
-
231
-
232
-
233
-
234
-
235
-
236
-
237
-
238
-
239
-
240
-
241
-
242
-
243
-
244
 |
 |

Philips Annual Report 2006 209
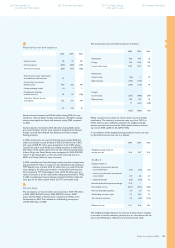
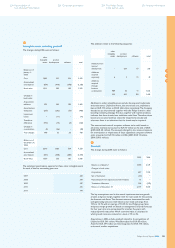
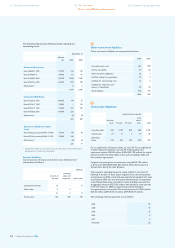
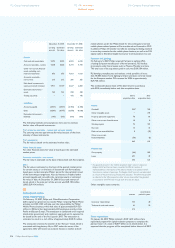
The weighted average assumptions used to calculate the projected
benefi t obligations as of December 31 were as follows:
2005 2006
Netherlands
other
Netherlands
other
Discount rate 4.2% 5.1% 4.3% 5.2%
Rate of
compensation
increase * 3.4% * 3.5%
The weighted average assumptions used to calculate the net periodic
pension cost for years ended December 31:
2005 2006
Netherlands
other
Netherlands
other
Discount rate 4.5% 5.4% 4.2% 5.1%
Expected
returns on plan
assets 5.7% 6.5% 5.7% 6.1%
Rate of
compensation
increase * 3.5% * 3.4%
* The rate of compensation increase for the Netherlands consists of a general
compensation increase and an individual salary increase based on merit,
seniority and promotion. The average individual salary increase for all active
participants for the remaining working lifetime is 0.75% annually. The assumed
rate of general compensation increase for the Netherlands for calculating the
projected benefi t obligations, amounts to 2% until 2008. From 2008 onwards
a rate of compensation increase of 1% is assumed. The difference refl ects
a change in indexation policy.
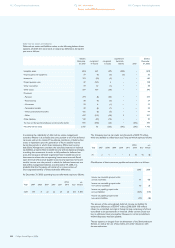
Historical data
2006
Present value of defi ned-benefi t obligations 20,410
Fair value of plan assets 21,352
Surplus 942
Experience adjustments in % on
- defi ned-benefi t obligations gain (loss) (0.9% )
- fair value of plan assets gain (loss) (0.8% )
Defi ned-benefi t plans: other postretirement benefi ts
In addition to providing pension benefi ts, the Company provides other
postretirement benefi ts, primarily retiree healthcare benefi ts, in certain
countries. The Company funds other postretirement benefi t plans as
claims are incurred.
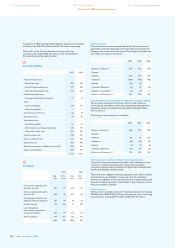
Movements in the net liability for other defi ned-benefi t obligations:
2005 2006
Projected benefi t obligation at the beginning of year 715 447
Service cost 19 4
Interest cost 40 26
Actuarial gains (25 ) (12 )
Curtailments (319 ) −
Changes in consolidation − (2 )
Benefi ts paid (40 ) (65 )
Exchange rate differences 57 (26 )
Miscellaneous − 1
Projected benefi t obligation at end of year 447 373
Present value of funded obligations at end of year − −
Present value of unfunded obligations at end of year 447 373
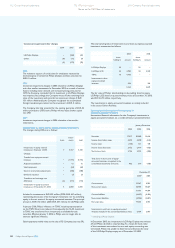
2005 2006
Funded status (447 ) (373 )
Unrecognized actuarial losses (38 ) (35 )
Net balances (485 ) (408 )
Classifi cation of the net balance is as follows:
Provision for other postretirement benefi ts - (484 ) (408 )
Provision for other postretirement benefi ts
related to discontinued operations
-
(1 ) −
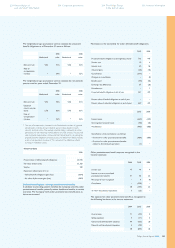
Other postretirement benefi t expense recognized in the
income statement:
2004 2005 2006
Service cost 17 19 4
Interest cost on accumulated
postretirement benefi ts 41 40 26
Net actuarial loss recognized − 4 (4 )
Curtailment − (308 ) −
58 (245 ) 26
of which discontinued operations 3 (23 ) −
The expense for other postretirement benefi ts is recognized in
the following line items in the income statement:
2004 2005 2006
Cost of sales 11 (50 ) 3
Selling expenses 4 (11 ) 3
General and administrative expenses 40 (156 ) 20
Research and development expenses 3 (28 ) −
58 (245 ) 26
226 Corporate governance224 Reconciliation of
non-US GAAP information
234 The Philips Group
in the last ten years
236 Investor information