Philips 2006 Annual Report Download - page 70
Download and view the complete annual report
Please find page 70 of the 2006 Philips annual report below. You can navigate through the pages in the report by either clicking on the pages listed below, or by using the keyword search tool below to find specific information within the annual report.-
 1
1 -
2
-
3
-
4
-
5
-
6
-
7
-
8
-
9
-
10
-
11
-
12
-
13
-
14
-
15
-
16
-
17
-
18
-
19
-
20
-
21
-
22
-
23
-
24
-
25
-
26
-
27
-
28
-
29
-
30
-
31
-
32
-
33
-
34
-
35
-
36
-
37
-
38
-
39
-
40
-
41
-
42
-
43
-
44
-
45
-
46
-
47
-
48
-
49
-
50
-
51
-
52
-
53
-
54
-
55
-
56
-
57
-
58
-
59
-
 60
60 -
 61
61 -
 62
62 -
 63
63 -
 64
64 -
 65
65 -
 66
66 -
 67
67 -
 68
68 -
 69
69 -
 70
70 -
 71
71 -
 72
72 -
 73
73 -
 74
74 -
 75
75 -
 76
76 -
 77
77 -
 78
78 -
 79
79 -
 80
80 -
81
-
82
-
83
-
84
-
85
-
86
-
87
-
88
-
89
-
90
-
91
-
92
-
93
-
94
-
95
-
96
-
97
-
98
-
99
-
100
-
101
-
102
-
103
-
104
-
105
-
106
-
107
-
108
-
109
-
110
-
111
-
112
-
113
-
114
-
115
-
116
-
117
-
118
-
119
-
120
-
121
-
122
-
123
-
124
-
125
-
126
-
127
-
128
-
129
-
130
-
131
-
132
-
133
-
134
-
135
-
136
-
137
-
138
-
139
-
140
-
141
-
142
-
143
-
144
-
145
-
146
-
147
-
148
-
149
-
150
-
151
-
152
-
153
-
154
-
155
-
156
-
157
-
158
-
159
-
160
-
161
-
162
-
163
-
164
-
165
-
166
-
167
-
168
-
169
-
170
-
171
-
172
-
173
-
174
-
175
-
176
-
177
-
178
-
179
-
180
-
181
-
182
-
183
-
184
-
185
-
186
-
187
-
188
-
189
-
190
-
191
-
192
-
193
-
194
-
195
-
196
-
197
-
198
-
199
-
200
-
201
-
202
-
203
-
204
-
205
-
206
-
207
-
208
-
209
-
210
-
211
-
212
-
213
-
214
-
215
-
216
-
217
-
218
-
219
-
220
-
221
-
222
-
223
-
224
-
225
-
226
-
227
-
228
-
229
-
230
-
231
-
232
-
233
-
234
-
235
-
236
-
237
-
238
-
239
-
240
-
241
-
242
-
243
-
244
 |
 |

Philips Annual Report 200670
Key data
in millions of euros
20031) 20041) 2005
Sales 2,218 2,482 2,041
Sales growth
% increase (decrease), nominal
% increase (decrease), comparable
(25
(5
)
)
12
18
(18
(5
)
)
EBIT Corporate Technologies (293) (323) (219)
EBIT Corporate Investments (63) 35 (62)
EBIT Other 93 654 125
Total earnings before interest and tax
as a % of sales
(263
(11.9
)
)
366
14.7
(156
(7.6
)
)
Net operating capital (NOC) 150 117 272
Cash fl ows before fi nancing activities
(769) 741 2,584
Employees 27,086 23,869 19,050
Key data
in millions of euros
2004 2005 2006
Sales 9,919 10,422 10,576
Sales growth
% increase, nominal 8 5 1
% increase, comparable 11 5 5
EBITA 370 506 417
as a % of sales 3.7 4.9 3.9
EBIT 370 506 416
as a % of sales 3.7 4.9 3.9
Net operating capital (NOC) (161) (296) (228)
Cash fl ows before fi nancing activities
503 650 351
Employees (FTEs) 16,993 15,537 14,486
For a reconciliation to the most directly comparable US GAAP measures,
see the chapter Reconciliation of non-US GAAP information
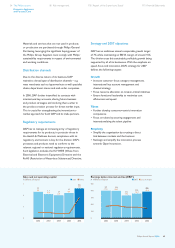
EBIT for 2006 amounted to EUR 416 million, compared
to EUR 506 million in 2005, including the gain attributable
to the TPV transaction.
Net operating capital was negative EUR 228 million
(2005: negative EUR 296 million), refl ecting the ongoing
success of the division’s asset-light strategy.
The beginning of 2007 is expected to be challenging
for CE due to continuing pressure on margins as supply
of FlatTVs outstrips market demand. Nevertheless, CE
expects to achieve an EBITA margin of approximately
3% for the full year 2007, helped by the introduction
of a new range of Ambilight televisions.
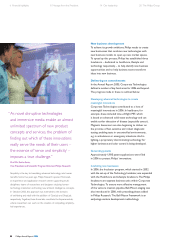
Leading industry awards
In 2006, CE products won several prestigious awards.
The European Imaging & Sound Association (EISA)
named the Philips Cineos 37PF9731D ‘European High-
End LCD TV, 2006-2007’, while the ‘European Green TV
of the Year’ went to Philips’ 42PF7621D set. CE won seven
Innovation Awards at the 2006 Consumer Electronics
Show (CES) in the US. The awards covered fi ve categories:
‘Home Theater’, ‘Audio Accessories’, ‘Digital Displays’,
‘Telephony’ and ‘Video Accessories’. In addition, seven
CE products were given a coveted iF Design Award
by the International Forum Design Hanover.
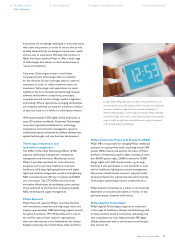
Sourcing
CE purchases fi nished products and components on
a global basis. For many years, CE has implemented a
dual sourcing strategy to ensure competitive sourcing
and continuity of supplies. In parallel, strategic partnerships
have been established in a number of areas such as LCD
panels, EMS (Electronic Manufacturing Services), etc.
Materials and services not used in products or
production are sourced by Philips General Purchasing
to ensure maximum leverage from the Philips Group’s
purchasing power.
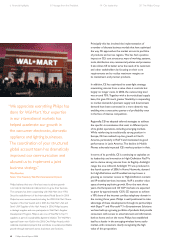
Distribution channels
CE products are channeled towards the consumer
primarily through local and international retailers.
The division offers a broad range of products from
high to low price/value quartiles, necessitating a diverse
distribution model that includes mass merchants, retail
chains, independents and small specialty stores often
represented by buying groups. In order to work in the
most effective way with these retail channels, Philips
has created an organization designed around its retail
customers, with Global Key Account Managers and
Country Ambassadors.
Philips Annual Report 200670
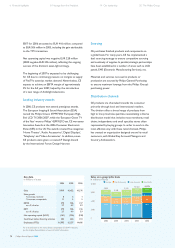
9,855
2,388
649
1,545
5,273
Sales on a geographic basis
in millions of euros
Europe North America LatinAmerica Asia Pacific
12,000
9,000
6,000
3,000
0
2002
4,957
2,131
1,586
2003
9,188
5,194
2,011
1,983
2004
9,919
5,101
2,525
1,786
2005
10,422
5,418
2,496
1,533
2006
10,576
514 731 1,010 1,129
6 Financial highlights 8 Message from the President 14 Our leadership 20 The Philips Group