Philips 2006 Annual Report Download - page 237
Download and view the complete annual report
Please find page 237 of the 2006 Philips annual report below. You can navigate through the pages in the report by either clicking on the pages listed below, or by using the keyword search tool below to find specific information within the annual report.-
 1
1 -
2
-
3
-
4
-
5
-
6
-
7
-
8
-
9
-
10
-
11
-
12
-
13
-
14
-
15
-
16
-
17
-
18
-
19
-
20
-
21
-
22
-
23
-
24
-
25
-
26
-
27
-
28
-
29
-
30
-
31
-
32
-
33
-
34
-
35
-
36
-
37
-
38
-
39
-
40
-
41
-
42
-
43
-
44
-
45
-
46
-
47
-
48
-
49
-
50
-
51
-
52
-
53
-
54
-
55
-
56
-
57
-
58
-
59
-
60
-
61
-
62
-
63
-
64
-
65
-
66
-
67
-
68
-
69
-
70
-
71
-
72
-
73
-
74
-
75
-
76
-
77
-
78
-
79
-
80
-
81
-
82
-
83
-
84
-
85
-
86
-
87
-
88
-
89
-
90
-
91
-
92
-
93
-
94
-
95
-
96
-
97
-
98
-
99
-
100
-
101
-
102
-
103
-
104
-
105
-
106
-
107
-
108
-
109
-
110
-
111
-
112
-
113
-
114
-
115
-
116
-
117
-
118
-
119
-
120
-
121
-
122
-
123
-
124
-
125
-
126
-
127
-
128
-
129
-
130
-
131
-
132
-
133
-
134
-
135
-
136
-
137
-
138
-
139
-
140
-
141
-
142
-
143
-
144
-
145
-
146
-
147
-
148
-
149
-
150
-
151
-
152
-
153
-
154
-
155
-
156
-
157
-
158
-
159
-
160
-
161
-
162
-
163
-
164
-
165
-
166
-
167
-
168
-
169
-
170
-
171
-
172
-
173
-
174
-
175
-
176
-
177
-
178
-
179
-
180
-
181
-
182
-
183
-
184
-
185
-
186
-
187
-
188
-
189
-
190
-
191
-
192
-
193
-
194
-
195
-
196
-
197
-
198
-
199
-
200
-
201
-
202
-
203
-
204
-
205
-
206
-
207
-
208
-
209
-
210
-
211
-
212
-
213
-
214
-
215
-
216
-
217
-
218
-
219
-
220
-
221
-
222
-
223
-
224
-
225
-
226
-
 227
227 -
 228
228 -
 229
229 -
 230
230 -
 231
231 -
 232
232 -
 233
233 -
 234
234 -
 235
235 -
 236
236 -
 237
237 -
 238
238 -
 239
239 -
 240
240 -
 241
241 -
 242
242 -
 243
243 -
 244
244
 |
 |
Philips Annual Report 2006 237
Listings
Philips’ shares are listed on Euronext Amsterdam (PHIA) and the New York
Stock Exchange (PHG), the latter in ADR (American Depositary Receipt) form.
226 Corporate governance224 Reconciliation of
non-US GAAP information
234 The Philips Group
in the last ten years
236 Investor information
Euronext Amsterdam
10.00
15.00
20.00
25.00
30.00
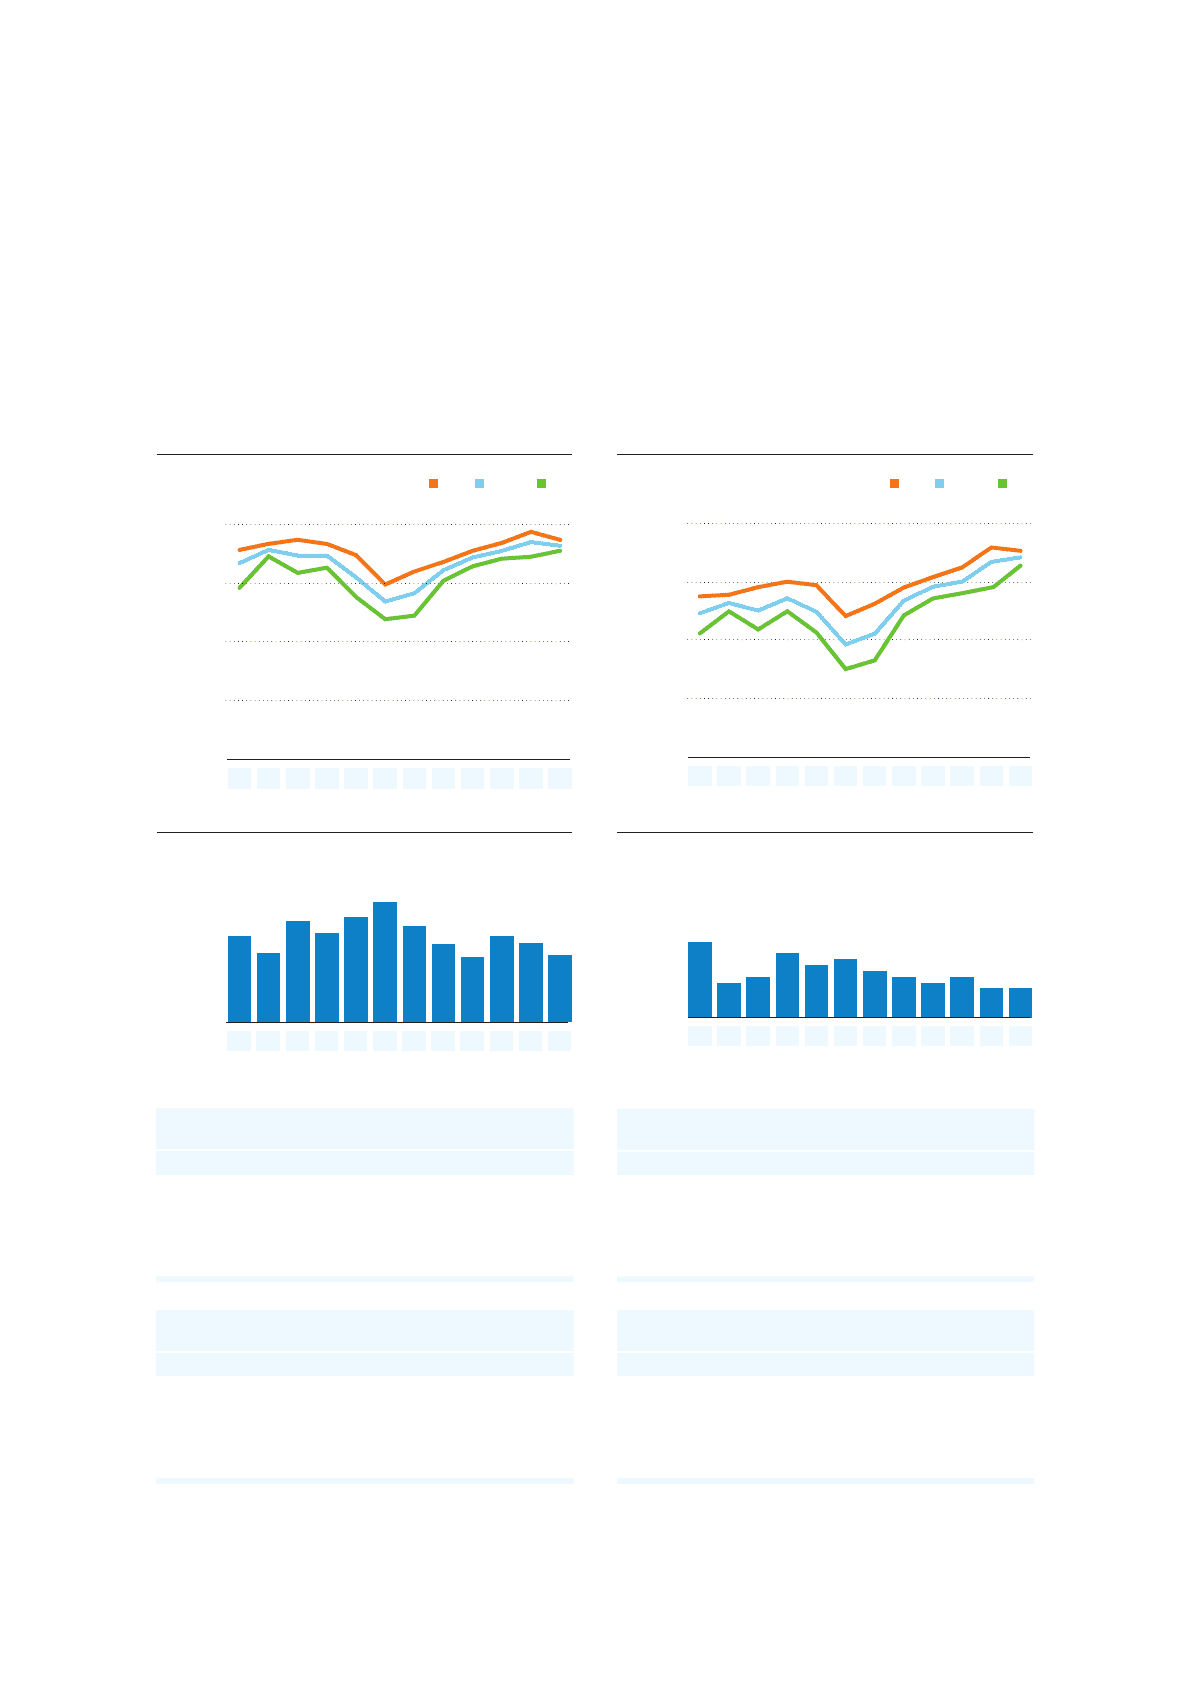
Share price development in Amsterdam, 2006
share price in euros Average LowHigh
0
5.0
10.0
Average daily trading volume in millions
7.3
5.9
8.6 7.6
8.9
10.2
8.2
6.6
5.5
7.3 6.7 5.7
Source: Bloomberg
Jan Feb Mar Apr May Jun Jul Aug Sep Oct Nov Dec
Jan Feb Mar Apr May Jun Jul Aug Sep Oct Nov Dec
Share price development: January – June
in euros
Jan Feb Mar Apr May Jun
High 27.78 28.30 28.65 28.29 27.35 24.84
Average 26.66 27.78 27.10 27.31 25.44 23.40
Low 25.35 27.23 25.84 26.28 23.77 21.89
Share price development: July – December
in euros
Jul Aug Sep Oct Nov Dec
High 25.95 26.76 27.71 28.37 29.31 28.61
Average 24.10 26.06 27.14 27.70 28.45 28.13
Low 22.20 25.17 26.39 27.03 27.20 27.72
New York Stock Exchange
20.00
25.00
30.00
35.00
40.00
Share price development in New York, 2006
share price in USD Average LowHigh
0
1.0
2.0
Average daily trading volume in millions
1.3
0.6 0.7
1.1 0.9 1.0 0.8 0.7 0.6 0.7 0.5 0.5
Source: Bloomberg
Jan Feb Mar Apr May Jun Jul Aug Sep Oct Nov Dec
Jan Feb Mar Apr May Jun Jul Aug Sep Oct Nov Dec
Share price development: January – June
in USD
Jan Feb Mar Apr May Jun
High 33.75 33.89 34.54 35.01 34.71 32.06
Average 32.30 33.18 32.53 33.59 32.42 29.63
Low 30.58 32.47 30.92 32.48 30.66 27.53
Share price development: July – December
in USD
Jul Aug Sep Oct Nov Dec
High 33.12 34.51 35.41 36.23 37.94 37.65
Average 30.56 33.39 34.57 35.01 36.70 37.09
Low 28.28 32.12 33.57 34.02 34.56 36.39