Philips 2006 Annual Report Download - page 58
Download and view the complete annual report
Please find page 58 of the 2006 Philips annual report below. You can navigate through the pages in the report by either clicking on the pages listed below, or by using the keyword search tool below to find specific information within the annual report.-
 1
1 -
2
-
3
-
4
-
5
-
6
-
7
-
8
-
9
-
10
-
11
-
12
-
13
-
14
-
15
-
16
-
17
-
18
-
19
-
20
-
21
-
22
-
23
-
24
-
25
-
26
-
27
-
28
-
29
-
30
-
31
-
32
-
33
-
34
-
35
-
36
-
37
-
38
-
39
-
40
-
41
-
42
-
43
-
44
-
45
-
46
-
47
-
 48
48 -
 49
49 -
 50
50 -
 51
51 -
 52
52 -
 53
53 -
 54
54 -
 55
55 -
 56
56 -
 57
57 -
 58
58 -
 59
59 -
 60
60 -
 61
61 -
 62
62 -
 63
63 -
 64
64 -
 65
65 -
 66
66 -
 67
67 -
 68
68 -
69
-
70
-
71
-
72
-
73
-
74
-
75
-
76
-
77
-
78
-
79
-
80
-
81
-
82
-
83
-
84
-
85
-
86
-
87
-
88
-
89
-
90
-
91
-
92
-
93
-
94
-
95
-
96
-
97
-
98
-
99
-
100
-
101
-
102
-
103
-
104
-
105
-
106
-
107
-
108
-
109
-
110
-
111
-
112
-
113
-
114
-
115
-
116
-
117
-
118
-
119
-
120
-
121
-
122
-
123
-
124
-
125
-
126
-
127
-
128
-
129
-
130
-
131
-
132
-
133
-
134
-
135
-
136
-
137
-
138
-
139
-
140
-
141
-
142
-
143
-
144
-
145
-
146
-
147
-
148
-
149
-
150
-
151
-
152
-
153
-
154
-
155
-
156
-
157
-
158
-
159
-
160
-
161
-
162
-
163
-
164
-
165
-
166
-
167
-
168
-
169
-
170
-
171
-
172
-
173
-
174
-
175
-
176
-
177
-
178
-
179
-
180
-
181
-
182
-
183
-
184
-
185
-
186
-
187
-
188
-
189
-
190
-
191
-
192
-
193
-
194
-
195
-
196
-
197
-
198
-
199
-
200
-
201
-
202
-
203
-
204
-
205
-
206
-
207
-
208
-
209
-
210
-
211
-
212
-
213
-
214
-
215
-
216
-
217
-
218
-
219
-
220
-
221
-
222
-
223
-
224
-
225
-
226
-
227
-
228
-
229
-
230
-
231
-
232
-
233
-
234
-
235
-
236
-
237
-
238
-
239
-
240
-
241
-
242
-
243
-
244
 |
 |

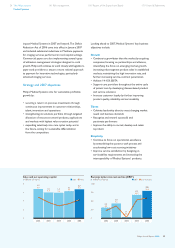
Philips Annual Report 200658
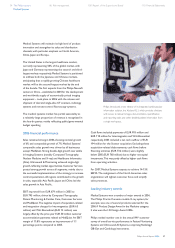
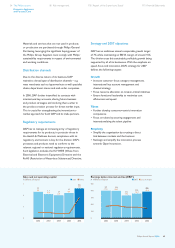
Key data
in millions of euros
2004 2005 2006
Sales 5,884 6,343 6,742
Sales growth
% increase (decrease), nominal (2) 8 6
% increase, comparable 4 7 7
EBITA 715 770 936
as a % of sales 12.2 12.1 13.9
EBIT 35 679 795
as a % of sales 0.6 10.7 11.8
Net operating capital (NOC) 2,862 3,400 4,332
Cash fl ows before fi nancing activities
677 566 (371)
Employees (FTEs) 30,790 30,978 32,843
For a reconciliation to the most directly comparable US GAAP measures, see the
chapter Reconciliation of non-US GAAP information.
Philips also received the American Heart Association’s
Cor Vitae Award, given each year to a member of the
corporate community who enhances the quality of life
in the community through innovation, philanthropy, vision
and leadership. The company was also named best-in-
class winner in the 2006 MS-HUG Annual Awards for
the Clinical/Patient Information Systems category. This
award recognizes the breakthrough contribution being
made by healthcare organizations and individuals to
drive effi ciencies across the healthcare system.
Sourcing
Medical Systems sources sub-assembly units from
a limited number of global suppliers. The drive towards
supplier consolidation continues, with Medical Systems
on target to procure 80% of its bill of materials from
fewer than 100 preferred suppliers by mid-2007.
A strong focus on early supplier involvement and value
engineering allowed Medical Systems to weather the
volatility of the metal commodity market during 2006.
In addition to early supplier involvement and value
engineering, Medical Systems continues its focus
on sourcing in low-cost countries, with bill of materials
spending in these countries increasing by 7% in 2006.
In support of Philips’ strong position in sustainability,
Medical Systems actively monitors existing and potential
new suppliers in identifi ed high-risk countries.
Distribution channels
Marketing, sales and service channels are mainly direct.
In certain geographical areas Medical Systems works with
third-party specialized system integrators and distributors.
Regulatory requirements
Medical Systems strives for full compliance with regulatory
product approval and quality system requirements in every
market it serves by addressing specifi c terms and conditions
of local ministry of health or federal regulatory authorities,
including agencies like the US FDA, EU Competent
Authorities and Japanese MLHW. Environmental and
sustainability requirements like the European Union’s
Waste from Electrical and
Electronic Equipment (WEEE)
and the Chinese Restriction
of Hazardous Substances
(RoHS) directives are met with comprehensive EcoDesign
and manufacturing programs to reduce the use of
hazardous materials.
Continuous clinical innovation and breakthroughs, in
combination with collaborative customer relationships,
drive growth and profi tability. However, the success of
clinical innovation is often dependent upon appropriate
reimbursement. In the US, concern over rapid and
sustained growth in imaging services has attracted
increased scrutiny by the Federal government and
commercial payers. This has resulted in the adoption
of new strategies designed to curb growth that could
Philips Annual Report 200658
Sales on a geographic basis
in millions of euros
Europe NorthAmerica LatinAmerica Asia Pacific
7,500
5,000
2,500
0
1,703
4,166
816
2002
6,844
1,773
3,235
842
2003
5,991
1,840
3,025
855
2004
5,884
1,904
3,140
1,047
2005
6,343
1,975
3,347
1,160
2006
6,742
159
141 164 252 260
6 Financial highlights 8 Message from the President 14 Our leadership 20 The Philips Group