Philips 2006 Annual Report Download - page 170
Download and view the complete annual report
Please find page 170 of the 2006 Philips annual report below. You can navigate through the pages in the report by either clicking on the pages listed below, or by using the keyword search tool below to find specific information within the annual report.-
 1
1 -
2
-
3
-
4
-
5
-
6
-
7
-
8
-
9
-
10
-
11
-
12
-
13
-
14
-
15
-
16
-
17
-
18
-
19
-
20
-
21
-
22
-
23
-
24
-
25
-
26
-
27
-
28
-
29
-
30
-
31
-
32
-
33
-
34
-
35
-
36
-
37
-
38
-
39
-
40
-
41
-
42
-
43
-
44
-
45
-
46
-
47
-
48
-
49
-
50
-
51
-
52
-
53
-
54
-
55
-
56
-
57
-
58
-
59
-
60
-
61
-
62
-
63
-
64
-
65
-
66
-
67
-
68
-
69
-
70
-
71
-
72
-
73
-
74
-
75
-
76
-
77
-
78
-
79
-
80
-
81
-
82
-
83
-
84
-
85
-
86
-
87
-
88
-
89
-
90
-
91
-
92
-
93
-
94
-
95
-
96
-
97
-
98
-
99
-
100
-
101
-
102
-
103
-
104
-
105
-
106
-
107
-
108
-
109
-
110
-
111
-
112
-
113
-
114
-
115
-
116
-
117
-
118
-
119
-
120
-
121
-
122
-
123
-
124
-
125
-
126
-
127
-
128
-
129
-
130
-
131
-
132
-
133
-
134
-
135
-
136
-
137
-
138
-
139
-
140
-
141
-
142
-
143
-
144
-
145
-
146
-
147
-
148
-
149
-
150
-
151
-
152
-
153
-
154
-
155
-
156
-
157
-
158
-
159
-
 160
160 -
 161
161 -
 162
162 -
 163
163 -
 164
164 -
 165
165 -
 166
166 -
 167
167 -
 168
168 -
 169
169 -
 170
170 -
 171
171 -
 172
172 -
 173
173 -
 174
174 -
 175
175 -
 176
176 -
 177
177 -
 178
178 -
 179
179 -
 180
180 -
181
-
182
-
183
-
184
-
185
-
186
-
187
-
188
-
189
-
190
-
191
-
192
-
193
-
194
-
195
-
196
-
197
-
198
-
199
-
200
-
201
-
202
-
203
-
204
-
205
-
206
-
207
-
208
-
209
-
210
-
211
-
212
-
213
-
214
-
215
-
216
-
217
-
218
-
219
-
220
-
221
-
222
-
223
-
224
-
225
-
226
-
227
-
228
-
229
-
230
-
231
-
232
-
233
-
234
-
235
-
236
-
237
-
238
-
239
-
240
-
241
-
242
-
243
-
244
 |
 |

Philips Annual Report 2006170
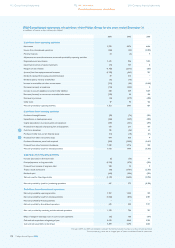
35
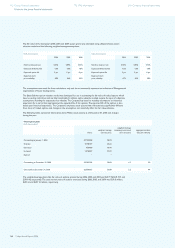
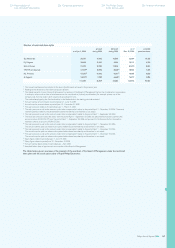
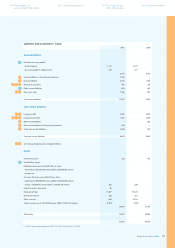
Fair value of fi nancial assets and liabilities
The estimated fair value of fi nancial instruments has been determined
by the Company using available market information and appropriate
valuation methods. The estimates presented are not necessarily
indicative of the amounts that will ultimately be realized by the
Company upon maturity or disposal. Additionally, because of the
variety of valuation techniques permitted under SFAS No. 107,
‘Disclosures about Fair Value of Financial Instruments’, comparisons
of fair values between entities may not be meaningful. The use of
different market assumptions and/or estimation methods may have
a material effect on the estimated fair value amounts.
December 31, 2005 December 31, 2006
carrying
amount
estimated
fair value
carrying
amount
estimated
fair value
Assets
Cash and cash equivalents 5,293 5,293 6,023 6,023
Accounts receivable -
current 4,638 4,638 4,773 4,773
Other non-current fi nancial
assets excluding cost-
method investments 673 673 7,013 7,013
Accounts receivable -
non-current 213 212 214 213
Main listed investments in
equity-accounted investees 5,091 11,139 2,735 2,803
Derivative instruments -
assets 143 143 298 298
Trading securities − − 192 192
Liabilities
Accounts payable (3,457 ) (3,457 ) (3,450 ) (3,450 )
Debt (4,487 ) (4,757 ) (3,869 ) (4,009 )
Derivative instruments -
liabilities (193 ) (193 ) (101 ) (101 )
The following methods and assumptions were used to estimate the
fair value of fi nancial instruments:
Cash, accounts receivable - current and accounts payable
The carrying amounts approximate fair value because of the short
maturity of these instruments.
Cash equivalents
The fair value is based on the estimated market value.
Other fi nancial assets
For other fi nancial assets, fair value is based upon the estimated
market prices.
Accounts receivable – non-current
The fair value is estimated on the basis of discounted cash fl ow
analyses.
Debt
The fair value is estimated on the basis of the quoted market prices
for certain issues, or on the basis of discounted cash fl ow analyses
based upon market rates plus Philips’ spread for the particular tenors
of the borrowing arrangements. Accrued interest is included under
accounts payable and not within the carrying amount or estimated fair
value of debt. At December 31, 2006 the accrued interest on bonds,
which is the main part of the accrual, was EUR 100 million (2005: EUR
106 million).
36
Other fi nancial instruments, derivatives
and currency risk
The Company does not purchase or hold fi nancial derivative
instruments for trading purposes. Assets and liabilities related to
derivative instruments are disclosed in note 11, note 12 and note 18
respectively. Currency fl uctuations may impact Philips’ fi nancial results.
The Company has a limited structural currency mismatch between
costs and revenues, as a proportion of its production, administration
and research and development costs is denominated in euros, while
a proportion of its revenues is denominated in US dollars.
The Company is exposed to currency risk in the following areas:
transaction exposures, such as forecasted sales and purchases, and
receivables or payables resulting from such transactions;
translation exposure of net income in foreign entities;
translation exposure of investments in foreign entities;
exposure of non-functional-currency-denominated debt; and
exposure of non-functional-currency-denominated equity
investments.
It is Philips’ policy that signifi cant transaction exposures are hedged.
The Philips policy generally requires committed foreign currency
exposures to be hedged fully using forwards. Anticipated transactions
are hedged using forwards or options or a combination thereof. The
policy for the hedging of anticipated exposures specifying the use of
forwards/options and the hedge tenor varies per business and is a
function of the ability to forecast cash fl ows and the way in which the
businesses can adapt to changed levels of foreign exchange rates. As a
result, hedging activities may not eliminate all currency risks for these
transaction exposures. Generally, the maximum tenor of these hedges
is less than 18 months. The Company does not hedge the exposure
arising from translation exposure of net income in foreign entities.
Translation exposure of equity invested in consolidated foreign entities
fi nanced by equity is partially hedged. If a hedge is entered into, it is
accounted for as a net investment hedge.
The currency of the external funding of the Company is matched
with the required fi nancing of subsidiaries either directly by external
foreign currency loans, or by using foreign exchange swaps.
Philips does not currently hedge the foreign exchange exposure arising
from equity-accounted investees. The Company uses foreign exchange
derivatives to manage its currency risk. The US dollar (including
related currencies such as the Hong Kong dollar) and Taiwanese dollar
account for a high percentage of the Company’s foreign exchange
derivatives. Apart from that, the Company has signifi cant derivatives
outstanding related to the pound sterling.
The Company hedges certain commodity price risks using derivative
instruments to minimize signifi cant, unanticipated earnings fl uctuations
caused by commodity price volatility. The commodity price derivatives
that the Company enters into are concluded as cash fl ow hedges to
offset forecasted purchases.
Changes in the value of foreign currency accounts receivable/payable
as well as the changes in the fair value of the hedges of accounts
receivable/payable are reported in the income statement under cost
of sales. The hedges related to forecasted transactions are recorded
as cash fl ow hedges. The results from such hedges are deferred within
other comprehensive income in stockholders’ equity. Currently, a gain
of EUR 8 million is deferred in stockholders’ equity as a result of these
hedges. The result deferred in equity will mostly be released to the
income statement in 2007 at the time when the related hedged
transactions affect the income statement. During 2006 a net loss
of less than EUR 1 million was recorded in the income statement
as a result of ineffectiveness of transaction hedges.
Changes in the fair value of hedges related to translation exposure
of investments in foreign entities fi nanced by debt are recognized in
the income statement. The changes in the fair value of these hedges
related to foreign exchange movements are offset in the income
statement by changes in the fair value of the hedged items. The
•
•
•
•
•
112 Group fi nancial statements
Notes to the group fi nancial statements
172 IFRS information 218 Company fi nancial statements