Philips 2006 Annual Report Download - page 97
Download and view the complete annual report
Please find page 97 of the 2006 Philips annual report below. You can navigate through the pages in the report by either clicking on the pages listed below, or by using the keyword search tool below to find specific information within the annual report.-
 1
1 -
2
-
3
-
4
-
5
-
6
-
7
-
8
-
9
-
10
-
11
-
12
-
13
-
14
-
15
-
16
-
17
-
18
-
19
-
20
-
21
-
22
-
23
-
24
-
25
-
26
-
27
-
28
-
29
-
30
-
31
-
32
-
33
-
34
-
35
-
36
-
37
-
38
-
39
-
40
-
41
-
42
-
43
-
44
-
45
-
46
-
47
-
48
-
49
-
50
-
51
-
52
-
53
-
54
-
55
-
56
-
57
-
58
-
59
-
60
-
61
-
62
-
63
-
64
-
65
-
66
-
67
-
68
-
69
-
70
-
71
-
72
-
73
-
74
-
75
-
76
-
77
-
78
-
79
-
80
-
81
-
82
-
83
-
84
-
85
-
86
-
 87
87 -
 88
88 -
 89
89 -
 90
90 -
 91
91 -
 92
92 -
 93
93 -
 94
94 -
 95
95 -
 96
96 -
 97
97 -
 98
98 -
 99
99 -
 100
100 -
 101
101 -
 102
102 -
 103
103 -
 104
104 -
 105
105 -
 106
106 -
 107
107 -
108
-
109
-
110
-
111
-
112
-
113
-
114
-
115
-
116
-
117
-
118
-
119
-
120
-
121
-
122
-
123
-
124
-
125
-
126
-
127
-
128
-
129
-
130
-
131
-
132
-
133
-
134
-
135
-
136
-
137
-
138
-
139
-
140
-
141
-
142
-
143
-
144
-
145
-
146
-
147
-
148
-
149
-
150
-
151
-
152
-
153
-
154
-
155
-
156
-
157
-
158
-
159
-
160
-
161
-
162
-
163
-
164
-
165
-
166
-
167
-
168
-
169
-
170
-
171
-
172
-
173
-
174
-
175
-
176
-
177
-
178
-
179
-
180
-
181
-
182
-
183
-
184
-
185
-
186
-
187
-
188
-
189
-
190
-
191
-
192
-
193
-
194
-
195
-
196
-
197
-
198
-
199
-
200
-
201
-
202
-
203
-
204
-
205
-
206
-
207
-
208
-
209
-
210
-
211
-
212
-
213
-
214
-
215
-
216
-
217
-
218
-
219
-
220
-
221
-
222
-
223
-
224
-
225
-
226
-
227
-
228
-
229
-
230
-
231
-
232
-
233
-
234
-
235
-
236
-
237
-
238
-
239
-
240
-
241
-
242
-
243
-
244
 |
 |

Philips Annual Report 2006 97
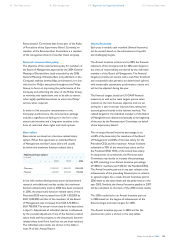
The impact of any plan changes and changes in investment
policies during 2006 may be seen by comparing the fi rst
and the second bars in each of the charts below. In fact,
there have only been relatively minor plan changes, with
very little impact on cost and risk. The only material
change in investment policy occurred in the UK, where
an extra contribution of GBP 400 million was followed
by a signifi cantly reduced asset-liability mismatch.
In 2006, Philips has made several divestments, of which
the sale of a majority stake in the Semiconductors division
and the sale of ETG were the most signifi cant. These two
divestments have led to a decline in pension obligations
and, as a consequence, reduced the sensitivity to changes
in interest rates. The impact of this on Philips’ total pension
risk may be seen by comparing the second and third bars
of each of the graphs below.
The differences between the third and the fourth bars in
these graphs measure the impact of factors other than
plan
changes, changes in investment policies and divestments.
The
remaining differences are mainly attributable to the changes
in interest rates and equity prices during 2006. Both equity
prices and interest rates increased in most countries.
The composition of the bars shows how funding risk may
be attributed to both economic factors (interest rate risk,
equity risk, infl ation risk and foreign exchange risk) and
country factors (risk exposures in the Netherlands, the
US, the UK and Germany). Because of the less than
100% (or even negative) correlation between the different
economic and/or country factors, the total risk may well be
lower than the sum of the underlying factors. This is called
the diversifi cation effect, which is also shown in the graphs.
Funded status
The extra contribution to the UK pension fund during 2006
and the subsequent de-risking of the investment policy
reduced the risk of the funded status by approximately
EUR 385 million. The divestment of the Semiconductors
division and ETG reduced it by another EUR 130 million.
These decreases were, however, partly offset by the impact
of movements in fi nancial markets, mainly as a result of
the consequent increase in plan assets in the Dutch pension
fund and the associated increase in its equity investments.
Equity risk is the major source of risk to the funded
status. It results from the relatively large allocations to
equity in the US and the large absolute exposure to equities
in the Dutch pension fund. The contribution of interest
rate risk results from the interest rate mismatch between
assets and liabilities in the Netherlands, the US and
Germany. Due to its large size, the Dutch pension fund
still causes most of the interest rate risk, even though
75% of its (nominal) pension liabilities are matched by
investments in fi xed-income instruments with similar
duration and convexity. Infl ation risk and foreign exchange
risk contribute relatively little to the funded status-at-
risk. The diversifi cation effect, which reduces total risk
by approximately EUR 330 million, is largely attributable
to the negative correlation between bonds and equities.
The extra contribution to the UK pension fund and the
reduction of its asset-liability mismatch have signifi cantly
lowered the contributions of interest rate and equity risk
to total risk. The divestments reduced the importance of
interest rate and infl ation risk.
The country decomposition shows that the Dutch pension
fund contributes most to the funded status-at-risk. Although
it matches 75% of its nominal liabilities, the remainder
of its assets is still largely invested in equities and (direct)
real estate. This, combined with the size of the fund,
explains the major part of its contribution to total risk.
Funding and de-risking the UK pension fund have signifi cantly
lowered the contribution of the fund to total risk. The
divestments primarily reduced the contributions of Philips’
risk exposures in the Netherlands and Germany.
On balance, in 2006, the funded status-at-risk decreased
by about EUR 435 million to EUR 1,705 million.
1) including plan and investment policy changes in 2006
2) after divestment of Semiconductors division and ETG
54 The Philips sectors 86 Risk management 100 Report of the Supervisory Board 110 Financial Statements