Philips 2006 Annual Report Download - page 152
Download and view the complete annual report
Please find page 152 of the 2006 Philips annual report below. You can navigate through the pages in the report by either clicking on the pages listed below, or by using the keyword search tool below to find specific information within the annual report.-
 1
1 -
2
-
3
-
4
-
5
-
6
-
7
-
8
-
9
-
10
-
11
-
12
-
13
-
14
-
15
-
16
-
17
-
18
-
19
-
20
-
21
-
22
-
23
-
24
-
25
-
26
-
27
-
28
-
29
-
30
-
31
-
32
-
33
-
34
-
35
-
36
-
37
-
38
-
39
-
40
-
41
-
42
-
43
-
44
-
45
-
46
-
47
-
48
-
49
-
50
-
51
-
52
-
53
-
54
-
55
-
56
-
57
-
58
-
59
-
60
-
61
-
62
-
63
-
64
-
65
-
66
-
67
-
68
-
69
-
70
-
71
-
72
-
73
-
74
-
75
-
76
-
77
-
78
-
79
-
80
-
81
-
82
-
83
-
84
-
85
-
86
-
87
-
88
-
89
-
90
-
91
-
92
-
93
-
94
-
95
-
96
-
97
-
98
-
99
-
100
-
101
-
102
-
103
-
104
-
105
-
106
-
107
-
108
-
109
-
110
-
111
-
112
-
113
-
114
-
115
-
116
-
117
-
118
-
119
-
120
-
121
-
122
-
123
-
124
-
125
-
126
-
127
-
128
-
129
-
130
-
131
-
132
-
133
-
134
-
135
-
136
-
137
-
138
-
139
-
140
-
141
-
 142
142 -
 143
143 -
 144
144 -
 145
145 -
 146
146 -
 147
147 -
 148
148 -
 149
149 -
 150
150 -
 151
151 -
 152
152 -
 153
153 -
 154
154 -
 155
155 -
 156
156 -
 157
157 -
 158
158 -
 159
159 -
 160
160 -
 161
161 -
 162
162 -
163
-
164
-
165
-
166
-
167
-
168
-
169
-
170
-
171
-
172
-
173
-
174
-
175
-
176
-
177
-
178
-
179
-
180
-
181
-
182
-
183
-
184
-
185
-
186
-
187
-
188
-
189
-
190
-
191
-
192
-
193
-
194
-
195
-
196
-
197
-
198
-
199
-
200
-
201
-
202
-
203
-
204
-
205
-
206
-
207
-
208
-
209
-
210
-
211
-
212
-
213
-
214
-
215
-
216
-
217
-
218
-
219
-
220
-
221
-
222
-
223
-
224
-
225
-
226
-
227
-
228
-
229
-
230
-
231
-
232
-
233
-
234
-
235
-
236
-
237
-
238
-
239
-
240
-
241
-
242
-
243
-
244
 |
 |

Philips Annual Report 2006152
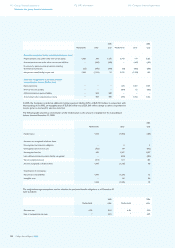
The estimated net actuarial loss and prior-service cost for the
defi ned-benefi t pension plans that will be amortized from accumulated
other comprehensive income into net periodic benefi t cost over next
year (2007) are EUR 69 million and EUR (28) million, respectively.
The Company also sponsors defi ned-contribution and similar types of
plans for a signifi cant number of salaried employees. The total cost of
these plans amounted to EUR 91 million in 2006 (2005: EUR 68 million,
2004: EUR 54 million) of which EUR 11 million (2005: EUR 12 million,
2004: EUR 11 million) relates to Semiconductors and has been presented
under discontinued operations. In 2006, the defi ned-contribution cost
includes contributions to multi-employer plans of EUR 4 million (2005:
EUR 3 million, 2004: EUR 1 million).
Cash fl ows
The Company expects considerable cash outfl ows in relation to
employee benefi ts which are estimated to amount to EUR 433 million
in 2007 (2006: EUR 1,086 million), consisting of EUR 288 million
employer contributions to defi ned-benefi t pension plans, EUR 80
million employer contributions to defi ned-contribution pension plans,
and EUR 65 million expected cash outfl ows in relation to unfunded
pension plans. The employer contributions to defi ned-benefi t pension
plans are expected to amount to EUR 160 million for the Netherlands
and EUR 128 million for other countries.
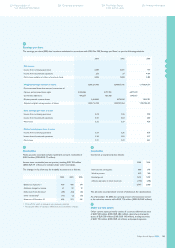
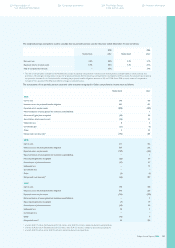
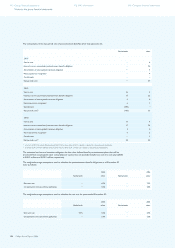
Estimated future pension benefi t payments
The following benefi t payments, which refl ect expected future service,
as appropriate, are expected to be paid:
2007 1,130
2008 1,181
2009 1,164
2010 1,176
2011 1,191
Years 2012-2016 6,368
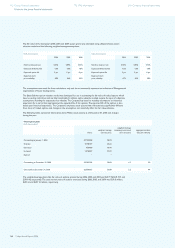
Netherlands other total
2006
The accumulated benefi t
obligation for all defi ned-
benefi t pension plans was 12,047 7,707 19,754
2005
The accumulated benefi t
obligation for all defi ned-
benefi t pension plans was 12,473 7,783 20,256
Plan assets: investment policies/strategies
Investment policies are reviewed at least once per year. The resulting
investment plans determine the strategic asset allocations, the constraints
on any tactical deviation from such strategic allocations, as well as the
constraints on geographical allocations and credit risk, etc., and will be
refl ected in the investment guidelines to the respective investment
managers. In order to keep the investment strategies in balance with
pension obligations, asset-liability reviews are carried out at least once
every three years. Generally, plan assets are invested in global equity
and debt markets (with the exception of debt or equity instruments
that have been issued by the Company or any of its subsidiaries) and
property. Derivatives of equity and debt instruments may be used
to realize swift changes in investment portfolios, to hedge against
unfavorable market developments or to fi ne tune any matching of
assets and liabilities.
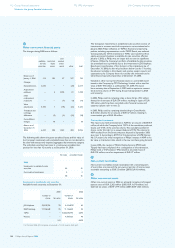
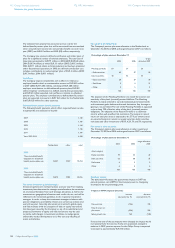
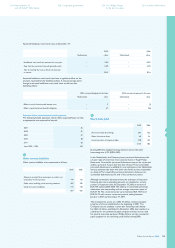
Plan assets in the Netherlands
The Company’s pension plan asset allocation in the Netherlands at
December 31, 2005 and 2006 and target allocation 2007 is as follows:
Percentage of plan assets at December 31
2005 2006
target
allocation 2007
Matching portfolio 60 57 56
Debt securities - 60 57 56
Return portfolio 40 43 44
Equity securities - 28 29 29
Real Estate - 9 9 11
Other - 3 5 4
100 100 100
The objective of the Matching Portfolio is to match the interest rate
sensitivity of the plan’s (nominal) pension liabilities. The Matching
Portfolio is mainly invested in euro-denominated government bonds
and investment grade debt securities and derivatives. Any leverage or
gearing is not permitted. The size of the Matching Portfolio is supposed
to be at least 75% of the fair value of the plan’s (nominal) pension
obligations. The objective of the Return Portfolio is to maximize
returns within well-specifi ed risk constraints. The long-term rate of
return on total plan assets is expected to be 5.7% per annum, based
on expected long-term returns on equity securities, debt securities,
real estate and other investments of 8.0%, 4.2%, 7% and 5%, respectively.
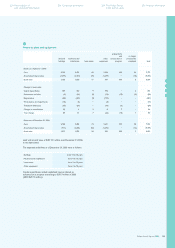
Plan assets in other countries
The Company’s pension plan asset allocation in other countries at
December 31, 2005 and 2006 and target allocation 2007 is as follows:
Percentage of plan assets at December 31
2005 2006
target allocation
2007
Asset category
Equity securities 39 26 20
Debt securities 52 68 72
Real estate 6 2 2
Other 3 4 6
100 100 100
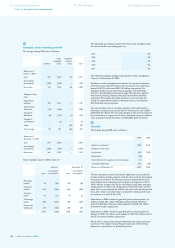
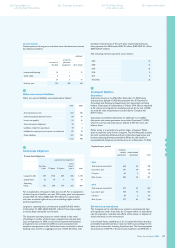
Sensitivity analysis
The table below illustrates the approximate impact on 2007 net
periodic pension cost (NPPC) if the Company were to change key
assumptions by one percentage point.
Impact on NPPC expense (income)
increase
assumption by 1%
decrease
assumption by 1%
Discount rate (146 ) 190
Rate of return on
plan assets (206 ) 206
Salary growth rate 160 (140 )
If more than one of the assumptions were changed, the impact would
not necessarily be the same as if only one assumption changed in
isolation. In 2007, pension expense for the Philips Group is expected
to amount to approximately EUR 100 million.
112 Group fi nancial statements
Notes to the group fi nancial statements
172 IFRS information 218 Company fi nancial statements