Philips 2006 Annual Report Download - page 43
Download and view the complete annual report
Please find page 43 of the 2006 Philips annual report below. You can navigate through the pages in the report by either clicking on the pages listed below, or by using the keyword search tool below to find specific information within the annual report.-
 1
1 -
2
-
3
-
4
-
5
-
6
-
7
-
8
-
9
-
10
-
11
-
12
-
13
-
14
-
15
-
16
-
17
-
18
-
19
-
20
-
21
-
22
-
23
-
24
-
25
-
26
-
27
-
28
-
29
-
30
-
31
-
32
-
 33
33 -
 34
34 -
 35
35 -
 36
36 -
 37
37 -
 38
38 -
 39
39 -
 40
40 -
 41
41 -
 42
42 -
 43
43 -
 44
44 -
 45
45 -
 46
46 -
 47
47 -
 48
48 -
 49
49 -
 50
50 -
 51
51 -
 52
52 -
 53
53 -
54
-
55
-
56
-
57
-
58
-
59
-
60
-
61
-
62
-
63
-
64
-
65
-
66
-
67
-
68
-
69
-
70
-
71
-
72
-
73
-
74
-
75
-
76
-
77
-
78
-
79
-
80
-
81
-
82
-
83
-
84
-
85
-
86
-
87
-
88
-
89
-
90
-
91
-
92
-
93
-
94
-
95
-
96
-
97
-
98
-
99
-
100
-
101
-
102
-
103
-
104
-
105
-
106
-
107
-
108
-
109
-
110
-
111
-
112
-
113
-
114
-
115
-
116
-
117
-
118
-
119
-
120
-
121
-
122
-
123
-
124
-
125
-
126
-
127
-
128
-
129
-
130
-
131
-
132
-
133
-
134
-
135
-
136
-
137
-
138
-
139
-
140
-
141
-
142
-
143
-
144
-
145
-
146
-
147
-
148
-
149
-
150
-
151
-
152
-
153
-
154
-
155
-
156
-
157
-
158
-
159
-
160
-
161
-
162
-
163
-
164
-
165
-
166
-
167
-
168
-
169
-
170
-
171
-
172
-
173
-
174
-
175
-
176
-
177
-
178
-
179
-
180
-
181
-
182
-
183
-
184
-
185
-
186
-
187
-
188
-
189
-
190
-
191
-
192
-
193
-
194
-
195
-
196
-
197
-
198
-
199
-
200
-
201
-
202
-
203
-
204
-
205
-
206
-
207
-
208
-
209
-
210
-
211
-
212
-
213
-
214
-
215
-
216
-
217
-
218
-
219
-
220
-
221
-
222
-
223
-
224
-
225
-
226
-
227
-
228
-
229
-
230
-
231
-
232
-
233
-
234
-
235
-
236
-
237
-
238
-
239
-
240
-
241
-
242
-
243
-
244
 |
 |

Philips Annual Report 2006 43
Employment
Employment
in FTEs
2004 2005 2006
Position at beginning of year 164,438 161,586 159,226
Consolidation changes:
- new consolidations 2,374 1,795 4,834
- deconsolidations (2,792) (2,552) (44,085)
- comparable change (2,434) (1,603) 1,757
Position at year-end 161,586 159,226 121,732
Excluding discontinued operations (MDS and
Semiconductors), the total number of employees
of the Philips Group was 121,732 at the end of 2006
compared to 121,809 at the end of 2005.
1) Excluding discontinued operations
The main employee increase in 2006 was in DAP (due to
the acquisition of Lifeline and Avent), Lighting (due to the
inclusion of Feixin and Bodine) and Medical Systems (due
to the acquisition of Witt Biomedical and Intermagnetics).
The largest reduction in 2006 occurred in Other Activities
(due to divestments within Corporate Investments).
Employees by sector
in FTEs at year-end
2004 2005 2006
Medical Systems 30,790 30,978 32,843
DAP 8,205 8,203 10,953
Consumer Electronics 16,993 15,537 14,486
Lighting 44,004 45,649 47,739
Other Activities 23,869 19,050 13,347
Unallocated 2,609 2,392 2,364
Discontinued operations 35,116 37,417 −
161,586 159,226 121,732
The Semiconductors division had a strong presence
in Asia. Following the sale of the majority stake in the
Semiconductors division, the number of Philips employees
in the Asia Pacifi c region was signifi cantly reduced.
Employees by geographic area
in FTEs at year-end
2004 2005 2006
Netherlands 20,476 20,068 17,510
Europe (excl. Netherlands) 35,492 34,860 34,446
USA and Canada 25,172 25,362 28,809
Latin America 13,497 13,692 13,194
Africa 409 404 389
Asia Pacifi c 31,424 27,423 27,384
126,470 121,809 121,732
Discontinued operations 35,116 37,417 −
161,586 159,226 121,732
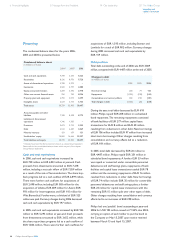
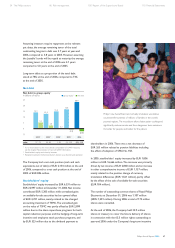
Sales per employee increased from EUR 209,000 in 2005
to EUR 218,000 in 2006, an increase of 4%. The increase
was evident particularly at CE, followed by DAP, Medical
Systems and Lighting.
Philips seeks to maintain constructive relationships with
the labor unions.
1) Excluding the Semiconductors division, which has been restated and presented
as a discontinued operation
54 The Philips sectors 86 Risk management 100 Report of the Supervisory Board 110 Financial Statements
Headcount per sector at year-end 20061)
Unallocated
2,364
Medical Systems
32,843
DAP
10,953
CE
14,486
Lighting
47,739
Other Activities
13,347
Average sales per employee
in thousands of euros
300
200
100
0
181
20021)
182
20031)
191
20041)
209
20051)
218
2006