Philips 2006 Annual Report Download - page 85
Download and view the complete annual report
Please find page 85 of the 2006 Philips annual report below. You can navigate through the pages in the report by either clicking on the pages listed below, or by using the keyword search tool below to find specific information within the annual report.-
 1
1 -
2
-
3
-
4
-
5
-
6
-
7
-
8
-
9
-
10
-
11
-
12
-
13
-
14
-
15
-
16
-
17
-
18
-
19
-
20
-
21
-
22
-
23
-
24
-
25
-
26
-
27
-
28
-
29
-
30
-
31
-
32
-
33
-
34
-
35
-
36
-
37
-
38
-
39
-
40
-
41
-
42
-
43
-
44
-
45
-
46
-
47
-
48
-
49
-
50
-
51
-
52
-
53
-
54
-
55
-
56
-
57
-
58
-
59
-
60
-
61
-
62
-
63
-
64
-
65
-
66
-
67
-
68
-
69
-
70
-
71
-
72
-
73
-
74
-
 75
75 -
 76
76 -
 77
77 -
 78
78 -
 79
79 -
 80
80 -
 81
81 -
 82
82 -
 83
83 -
 84
84 -
 85
85 -
 86
86 -
 87
87 -
 88
88 -
 89
89 -
 90
90 -
 91
91 -
 92
92 -
 93
93 -
 94
94 -
 95
95 -
96
-
97
-
98
-
99
-
100
-
101
-
102
-
103
-
104
-
105
-
106
-
107
-
108
-
109
-
110
-
111
-
112
-
113
-
114
-
115
-
116
-
117
-
118
-
119
-
120
-
121
-
122
-
123
-
124
-
125
-
126
-
127
-
128
-
129
-
130
-
131
-
132
-
133
-
134
-
135
-
136
-
137
-
138
-
139
-
140
-
141
-
142
-
143
-
144
-
145
-
146
-
147
-
148
-
149
-
150
-
151
-
152
-
153
-
154
-
155
-
156
-
157
-
158
-
159
-
160
-
161
-
162
-
163
-
164
-
165
-
166
-
167
-
168
-
169
-
170
-
171
-
172
-
173
-
174
-
175
-
176
-
177
-
178
-
179
-
180
-
181
-
182
-
183
-
184
-
185
-
186
-
187
-
188
-
189
-
190
-
191
-
192
-
193
-
194
-
195
-
196
-
197
-
198
-
199
-
200
-
201
-
202
-
203
-
204
-
205
-
206
-
207
-
208
-
209
-
210
-
211
-
212
-
213
-
214
-
215
-
216
-
217
-
218
-
219
-
220
-
221
-
222
-
223
-
224
-
225
-
226
-
227
-
228
-
229
-
230
-
231
-
232
-
233
-
234
-
235
-
236
-
237
-
238
-
239
-
240
-
241
-
242
-
243
-
244
 |
 |

Philips Annual Report 2006 85Philips Annual Report 2006 85
Unallocated
Pension and other postretirement benefi t costs
increased by EUR 70 million compared to 2005, when
a gain of EUR 116 million was recognized. The latter
was triggered by a change in Dutch law relating to
the treatment of medical insurance costs. Excluding
the EUR 116 million positive impact in 2005, pension
and other postretirement benefi t costs decreased
by EUR 46 million in 2006, mainly due to the sale
of the majority stake in the Semiconductors division.
Cash fl ows before fi nancing related to pension activities
decreased by EUR 863 million compared to 2005,
resulting in a total outfl ow of EUR 1,237 million.
The increased cash outfl ow was largely attributable
to additional funding of pension funds in the United
Kingdom (EUR 582 million) and the United States
(EUR 101 million).
From 2007 onwards, part of the costs of corporate
services will be charged to the operating divisions,
which drive and create value from these resources.
This will result in an approximate EUR 160 million
shift of costs from the Unallocated sector to the four
operating divisions (Medical Systems, DAP, CE and
Lighting). Separately, Philips expects to reduce
the overall Corporate and regional overhead cost
by EUR 75
million, on a run-rate basis, by the end of 2007.
In addition
, pension costs for continuing operations are
expected to decline by approximately EUR 50 million
in 2007 compared to 2006. Expenditures on the global
brand campaign are expected to be slightly below
the level of 2006, with the majority of the spend
in the second and fourth quarters of the year.
Introduction
The sector Unallocated comprises the activities of
the corporate center including Philips’ global brand
management and sustainability programs, as well
as country and regional overhead costs and costs
of pension and other postretirement benefi t plans.
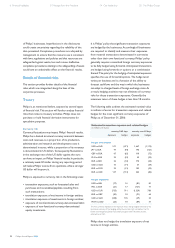
Key data
in millions of euros
2004 2005 2006
EBIT Corporate & regional
overheads
(309) (317) (389)
EBIT Global brand campaign (80) (138) (126)
EBIT pension / postretirement
benefi ts costs (151) (16) (86)
EBIT (540) (471) (601)
Net operating capital (NOC) (180) (558) 314
Cash fl ows before fi nancing activities
(182) (1,210) (2,015)
Employees (FTEs) 2,609 2,392 2,364
For a reconciliation to the most directly comparable US GAAP measures,
see the chapter Reconciliation of non-US GAAP information.
Corporate & Regional Overheads
Corporate and regional overhead costs were higher than
in 2005, primarily as a consequence of implementation
costs for Sarbanes-Oxley compliance, which totaled
EUR 26 million in 2006.
Costs for the global brand campaign decreased by
EUR 12 million compared to 2005.
54 The Philips sectors
Unallocated
86 Risk management 100 Report of the Supervisory Board 110 Financial Statements