Philips 2006 Annual Report Download - page 173
Download and view the complete annual report
Please find page 173 of the 2006 Philips annual report below. You can navigate through the pages in the report by either clicking on the pages listed below, or by using the keyword search tool below to find specific information within the annual report.-
 1
1 -
2
-
3
-
4
-
5
-
6
-
7
-
8
-
9
-
10
-
11
-
12
-
13
-
14
-
15
-
16
-
17
-
18
-
19
-
20
-
21
-
22
-
23
-
24
-
25
-
26
-
27
-
28
-
29
-
30
-
31
-
32
-
33
-
34
-
35
-
36
-
37
-
38
-
39
-
40
-
41
-
42
-
43
-
44
-
45
-
46
-
47
-
48
-
49
-
50
-
51
-
52
-
53
-
54
-
55
-
56
-
57
-
58
-
59
-
60
-
61
-
62
-
63
-
64
-
65
-
66
-
67
-
68
-
69
-
70
-
71
-
72
-
73
-
74
-
75
-
76
-
77
-
78
-
79
-
80
-
81
-
82
-
83
-
84
-
85
-
86
-
87
-
88
-
89
-
90
-
91
-
92
-
93
-
94
-
95
-
96
-
97
-
98
-
99
-
100
-
101
-
102
-
103
-
104
-
105
-
106
-
107
-
108
-
109
-
110
-
111
-
112
-
113
-
114
-
115
-
116
-
117
-
118
-
119
-
120
-
121
-
122
-
123
-
124
-
125
-
126
-
127
-
128
-
129
-
130
-
131
-
132
-
133
-
134
-
135
-
136
-
137
-
138
-
139
-
140
-
141
-
142
-
143
-
144
-
145
-
146
-
147
-
148
-
149
-
150
-
151
-
152
-
153
-
154
-
155
-
156
-
157
-
158
-
159
-
160
-
161
-
162
-
 163
163 -
 164
164 -
 165
165 -
 166
166 -
 167
167 -
 168
168 -
 169
169 -
 170
170 -
 171
171 -
 172
172 -
 173
173 -
 174
174 -
 175
175 -
 176
176 -
 177
177 -
 178
178 -
 179
179 -
 180
180 -
 181
181 -
 182
182 -
 183
183 -
184
-
185
-
186
-
187
-
188
-
189
-
190
-
191
-
192
-
193
-
194
-
195
-
196
-
197
-
198
-
199
-
200
-
201
-
202
-
203
-
204
-
205
-
206
-
207
-
208
-
209
-
210
-
211
-
212
-
213
-
214
-
215
-
216
-
217
-
218
-
219
-
220
-
221
-
222
-
223
-
224
-
225
-
226
-
227
-
228
-
229
-
230
-
231
-
232
-
233
-
234
-
235
-
236
-
237
-
238
-
239
-
240
-
241
-
242
-
243
-
244
 |
 |

Philips Annual Report 2006 173
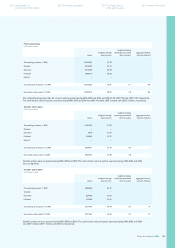
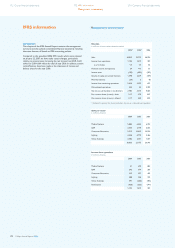
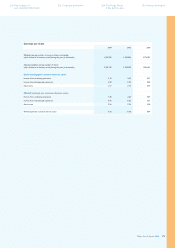
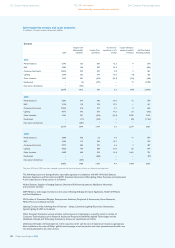
Net operating capital
in millions of euros
2004 2005 2006
Medical Systems 2,761 3,274 4,267
DAP 474 474 1,880
Consumer Electronics (71 ) (200 ) (134 )
Lighting 1,549 2,846 2,817
Other Activities 250 377 144
Unallocated (1,884 ) (2,307 ) (1,388 )
3,079 4,464 7,586
Sales in 2006 increased by 6% on a comparable basis compared to
2005 (5% nominally). Medical Systems (+7%), Domestic Appliances
and Personal Care (DAP) (+11%), Consumer Electronics (+5%) and
Lighting (+8%) all posted signifi cant comparable sales growth. Nominal
sales growth of 5% was mainly driven by DAP (+21%, boosted by the
acquisitions of Lifeline and Avent) and Lighting (+15%, impacted by
the acquisition of Lumileds). The overall sales increase in the main
operating sectors was partly offset by a 24% nominal sales decline
of Other Activities, affected by the divestments of Optical Storage,
Philips Business Communications and Enabling Technologies Group.
On an comparable basis, sales of Other Activities declined by 7%.
Gross margin of EUR 8,280 million increased by EUR 377 million,
compared to 2005, driven by the sales growth. Gross margin as a
percentage of sales was in line with the previous years 30.7% of sales.
The sales driven improvement was partly offset by a EUR 182 million
charge, primarily related to an additional accrual for unasserted
potential future claims in respect of asbestos-related product
liabilities, net of insurance recoveries.
For further details on asbestos-related product liabilities, see note 57
to the consolidated fi nancial statements in this Annual Report.
As a percentage of sales, selling expenses (17.4%) and research and
development expenses (6.0%) were only slightly different than in 2005.
General and administrative (G&A) expenses, however, increased both
in nominal terms (+ EUR 301 million) and as a percentage of sales to
4.5%. In 2006, additional implementation costs related to compliance
with section 404 of the US Sarbanes-Oxley Act were required, while
2005 included a release of a postretirement medical benefi ts provision.
Income from operations decreased by EUR 480 million, impacted
by the following signifi cant incidental items:
in 2006, a EUR 182 million charge, primarily related to an additional
accrual for asbestos-related product liabilities, net of insurance
recoveries, included in the Income from operations of Other
Activities;
in 2005, a EUR 279 million release of a postretirement medical
benefi ts provision, of which EUR 185 million was included in
Unallocated;
in 2005, a EUR 158 million gain on the sale of certain parts of CE’s
monitors and FlatTV business to TPV Technology.
Income from operations as a percentage of sales decreased from
5.5% to 3.5%, despite increases in income from operations achieved
by Medical Systems, DAP and Lighting.
Medical Systems generated an income from operations of EUR 842
million (2005: EUR 690 million), benefi ting from a 7% comparable
sales growth and improved gross margins, partly offset by acquisition-
related charges.
DAP improved its income from operations by EUR 13 million to
EUR 387 million. The sales-driven increase in income from operations
was partly offset by acquisition-related charges and the EUR 18 million
loss in the newly set-up Consumer Healthcare Solutions.
•
•
•
CE achieved an income from operations of EUR 402 million in 2006,
compared to EUR 527 million in 2005, which benefi ted from a EUR
158 million gain on the TPV transaction. The margin erosion in the fi rst
half of the year, due to intense competition, eased off in the second half
of the year. However, the beginning of 2007 is expected to be challenging,
due to continuing pressure on margins as supply of FlatTV outstrips
market demand.
Lighting’s income from operations increased to EUR 574 million
(2005: EUR 556 million), mainly driven by profi table sales growth,
lower non-manufacturing costs and the inclusion of Lumileds for
the full year.
Other Activities’ income from operations loss of EUR 475 million was
affected by a full-year charge of EUR 182 million for asbestos-related
product liabilities partly offset by gains on the sale of businesses.
The Unallocated sector generated a negative income from operations
of EUR 791 million (2005: negative EUR 522 million). The main reason
for the lower income from operations was the fact that 2005 benefi ted
from the EUR 185 million release of the postretirement medical
benefi ts provision, which was partly offset by lower pension and other
postretirement benefi ts costs in 2006.
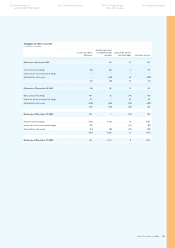
Net income attributable to stockholders in 2006 amounted to
EUR 4,664 million compared to EUR 3,374 million in 2005. The
increase is largely attributable to the after-tax gain of EUR 3,683
million on the sale of the majority stake in the Semiconductors
division and lower income tax, partly offset by the lower operational
result of LG.Philips LCD. Net income in 2005 included a gain on the
sale of several fi nancial holdings partly offset by an impairment charge
for LG.Philips Displays.
Cash fl ows before fi nancing activities provided by continuing operations
decreased from EUR 2,881 million in 2005 to a cash outfl ow of
EUR 2,459 million in 2006, which was mainly due to several acquisitions
and higher pension contributions in the United Kingdom and United
States. Cash fl ows in 2005 were positively affected by the sales of
several fi nancial holdings, mainly in NAVTEQ, TSMC and LG.Philips LCD.
226 Corporate governance224 Reconciliation of
non-US GAAP information
234 The Philips Group
in the last ten years
236 Investor information