Philips 2006 Annual Report Download - page 57
Download and view the complete annual report
Please find page 57 of the 2006 Philips annual report below. You can navigate through the pages in the report by either clicking on the pages listed below, or by using the keyword search tool below to find specific information within the annual report.-
 1
1 -
2
-
3
-
4
-
5
-
6
-
7
-
8
-
9
-
10
-
11
-
12
-
13
-
14
-
15
-
16
-
17
-
18
-
19
-
20
-
21
-
22
-
23
-
24
-
25
-
26
-
27
-
28
-
29
-
30
-
31
-
32
-
33
-
34
-
35
-
36
-
37
-
38
-
39
-
40
-
41
-
42
-
43
-
44
-
45
-
46
-
 47
47 -
 48
48 -
 49
49 -
 50
50 -
 51
51 -
 52
52 -
 53
53 -
 54
54 -
 55
55 -
 56
56 -
 57
57 -
 58
58 -
 59
59 -
 60
60 -
 61
61 -
 62
62 -
 63
63 -
 64
64 -
 65
65 -
 66
66 -
 67
67 -
68
-
69
-
70
-
71
-
72
-
73
-
74
-
75
-
76
-
77
-
78
-
79
-
80
-
81
-
82
-
83
-
84
-
85
-
86
-
87
-
88
-
89
-
90
-
91
-
92
-
93
-
94
-
95
-
96
-
97
-
98
-
99
-
100
-
101
-
102
-
103
-
104
-
105
-
106
-
107
-
108
-
109
-
110
-
111
-
112
-
113
-
114
-
115
-
116
-
117
-
118
-
119
-
120
-
121
-
122
-
123
-
124
-
125
-
126
-
127
-
128
-
129
-
130
-
131
-
132
-
133
-
134
-
135
-
136
-
137
-
138
-
139
-
140
-
141
-
142
-
143
-
144
-
145
-
146
-
147
-
148
-
149
-
150
-
151
-
152
-
153
-
154
-
155
-
156
-
157
-
158
-
159
-
160
-
161
-
162
-
163
-
164
-
165
-
166
-
167
-
168
-
169
-
170
-
171
-
172
-
173
-
174
-
175
-
176
-
177
-
178
-
179
-
180
-
181
-
182
-
183
-
184
-
185
-
186
-
187
-
188
-
189
-
190
-
191
-
192
-
193
-
194
-
195
-
196
-
197
-
198
-
199
-
200
-
201
-
202
-
203
-
204
-
205
-
206
-
207
-
208
-
209
-
210
-
211
-
212
-
213
-
214
-
215
-
216
-
217
-
218
-
219
-
220
-
221
-
222
-
223
-
224
-
225
-
226
-
227
-
228
-
229
-
230
-
231
-
232
-
233
-
234
-
235
-
236
-
237
-
238
-
239
-
240
-
241
-
242
-
243
-
244
 |
 |

Philips Annual Report 2006 57
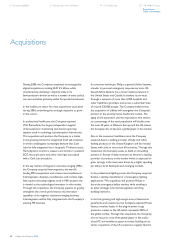
Cash fl ows included payments of EUR 993 million and
EUR 110 million for Intermagnetics and Witt Biomedical
respectively. 2005 included a net cash outfl ow of EUR
194 million for the Stentor acquisition. Excluding these
acquisition-related disbursements, cash fl ows before
fi nancing activities (EUR 732 million) were slightly
below 2005 (EUR 760 million) due to higher net capital
investments. This was partly offset by higher cash fl ows
from operating activities.
For 2007, Medical Systems expects to achieve 14-15%
EBITA. The realignment of the North American sales
organization will tighten customer focus and simplify
sales processes.
Leading industry awards
Medical Systems won a number of major awards in 2006.
The Philips Practix Convenio mobile X-ray system, for
example, was one of several products selected for the
2006 iF Product Design Award in the Medicine category.
It also won the I.D. Design Award 2006.
Philips ranked number one in the annual IMV customer
survey of overall service performance in Patient Monitoring
Systems and Ultrasound All Systems, comprising Radiology/
OB-Gyn and Cardiology instruments.
Medical Systems will maintain its high level of product
innovation and strengthen its sales and distribution
channels, with particular emphasis on North America,
China, Japan and Europe.
The United States is the largest healthcare market,
currently representing 50% of the global market, with
Japan and Germany representing the second- and third-
largest markets respectively. Medical Systems is positioned
to address both the Japanese and Chinese markets,
anticipating that a rapidly growing Chinese healthcare
market will be the second-largest market by the end
of the decade. The fi rst exports from the Philips-Neusoft
venture in China – established in 2004 for the development
and worldwide supply of economically priced imaging
equipment – took place in 2006 with the release and
shipment of dual and single-slice CT scanners, radiology
systems and remote-control fl uoroscopy systems.
The medical systems market has partial seasonality as
a relatively large proportion of revenue is recognized in
the fourth quarter, mainly refl ecting public/governmental
budget spending.
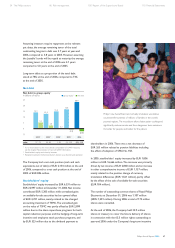
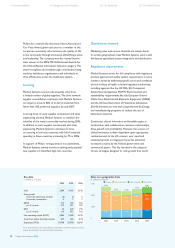
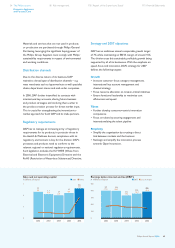
2006 fi nancial performance
Sales remained strong in 2006, showing nominal growth
of 6% and comparable growth of 7%. Medical Systems’
comparable sales growth was driven by all businesses
except MedQuist. Strong double-digit growth was visible
in Imaging Systems (notably Computed Tomography,
Nuclear Medicine and X-ray) and Healthcare Informatics
(iSite). Ultrasound & Monitoring achieved single-digit
growth, refl ecting market opportunities. Customer Services
posted strong growth across all segments, mainly due to
the successful implementation of the strategy to increase
contract penetration. All regions contributed to the growth
in sales, especially Asia Pacifi c. Japan and China led the
sales growth in Asia Pacifi c.
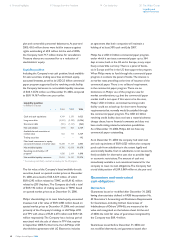
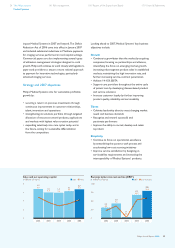
EBIT improved from EUR 679 million in 2005 to
EUR 795 million, driven by Computed Tomography,
Patient Monitoring & Cardiac Care, Customer Services
and MedQuist. The negative impact of acquisition-related
and integration charges for Intermagnetics (EUR 65
million) and Witt Biomedical (EUR 13 million) was
largely offset by the prior-year EUR 50 million
customer
accommodation payments related to
MedQuist.
An EBIT
margin of 11.8% represents an improvement of 1.1
percentage points compared to 2005.
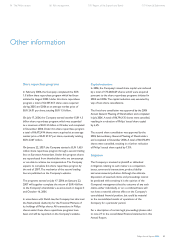
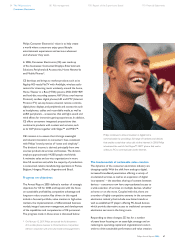
Philips introduced a new release of its integrated cardiovascular
information solution, the Xcelera R2.1, which provides clinicians
with access to relevant images, documentation, quantifi cation
and reporting tasks and other detailed patient information from
a single workspace.
54 The Philips sectors
Medical Systems
86 Risk management 100 Report of the Supervisory Board 110 Financial Statements