Philips 2006 Annual Report Download - page 7
Download and view the complete annual report
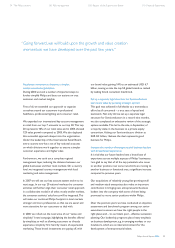
Please find page 7 of the 2006 Philips annual report below. You can navigate through the pages in the report by either clicking on the pages listed below, or by using the keyword search tool below to find specific information within the annual report.-
 1
1 -
 2
2 -
 3
3 -
 4
4 -
 5
5 -
 6
6 -
 7
7 -
 8
8 -
 9
9 -
 10
10 -
 11
11 -
 12
12 -
 13
13 -
 14
14 -
 15
15 -
 16
16 -
 17
17 -
 18
18 -
19
-
20
-
21
-
22
-
23
-
24
-
25
-
26
-
27
-
28
-
29
-
30
-
31
-
32
-
33
-
34
-
35
-
36
-
37
-
38
-
39
-
40
-
41
-
42
-
43
-
44
-
45
-
46
-
47
-
48
-
49
-
50
-
51
-
52
-
53
-
54
-
55
-
56
-
57
-
58
-
59
-
60
-
61
-
62
-
63
-
64
-
65
-
66
-
67
-
68
-
69
-
70
-
71
-
72
-
73
-
74
-
75
-
76
-
77
-
78
-
79
-
80
-
81
-
82
-
83
-
84
-
85
-
86
-
87
-
88
-
89
-
90
-
91
-
92
-
93
-
94
-
95
-
96
-
97
-
98
-
99
-
100
-
101
-
102
-
103
-
104
-
105
-
106
-
107
-
108
-
109
-
110
-
111
-
112
-
113
-
114
-
115
-
116
-
117
-
118
-
119
-
120
-
121
-
122
-
123
-
124
-
125
-
126
-
127
-
128
-
129
-
130
-
131
-
132
-
133
-
134
-
135
-
136
-
137
-
138
-
139
-
140
-
141
-
142
-
143
-
144
-
145
-
146
-
147
-
148
-
149
-
150
-
151
-
152
-
153
-
154
-
155
-
156
-
157
-
158
-
159
-
160
-
161
-
162
-
163
-
164
-
165
-
166
-
167
-
168
-
169
-
170
-
171
-
172
-
173
-
174
-
175
-
176
-
177
-
178
-
179
-
180
-
181
-
182
-
183
-
184
-
185
-
186
-
187
-
188
-
189
-
190
-
191
-
192
-
193
-
194
-
195
-
196
-
197
-
198
-
199
-
200
-
201
-
202
-
203
-
204
-
205
-
206
-
207
-
208
-
209
-
210
-
211
-
212
-
213
-
214
-
215
-
216
-
217
-
218
-
219
-
220
-
221
-
222
-
223
-
224
-
225
-
226
-
227
-
228
-
229
-
230
-
231
-
232
-
233
-
234
-
235
-
236
-
237
-
238
-
239
-
240
-
241
-
242
-
243
-
244
 |
 |
Philips Annual Report 2006 7Philips Annual Report 2006 7
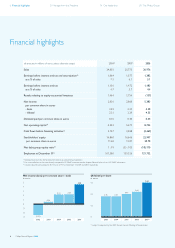
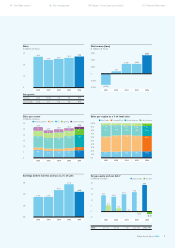
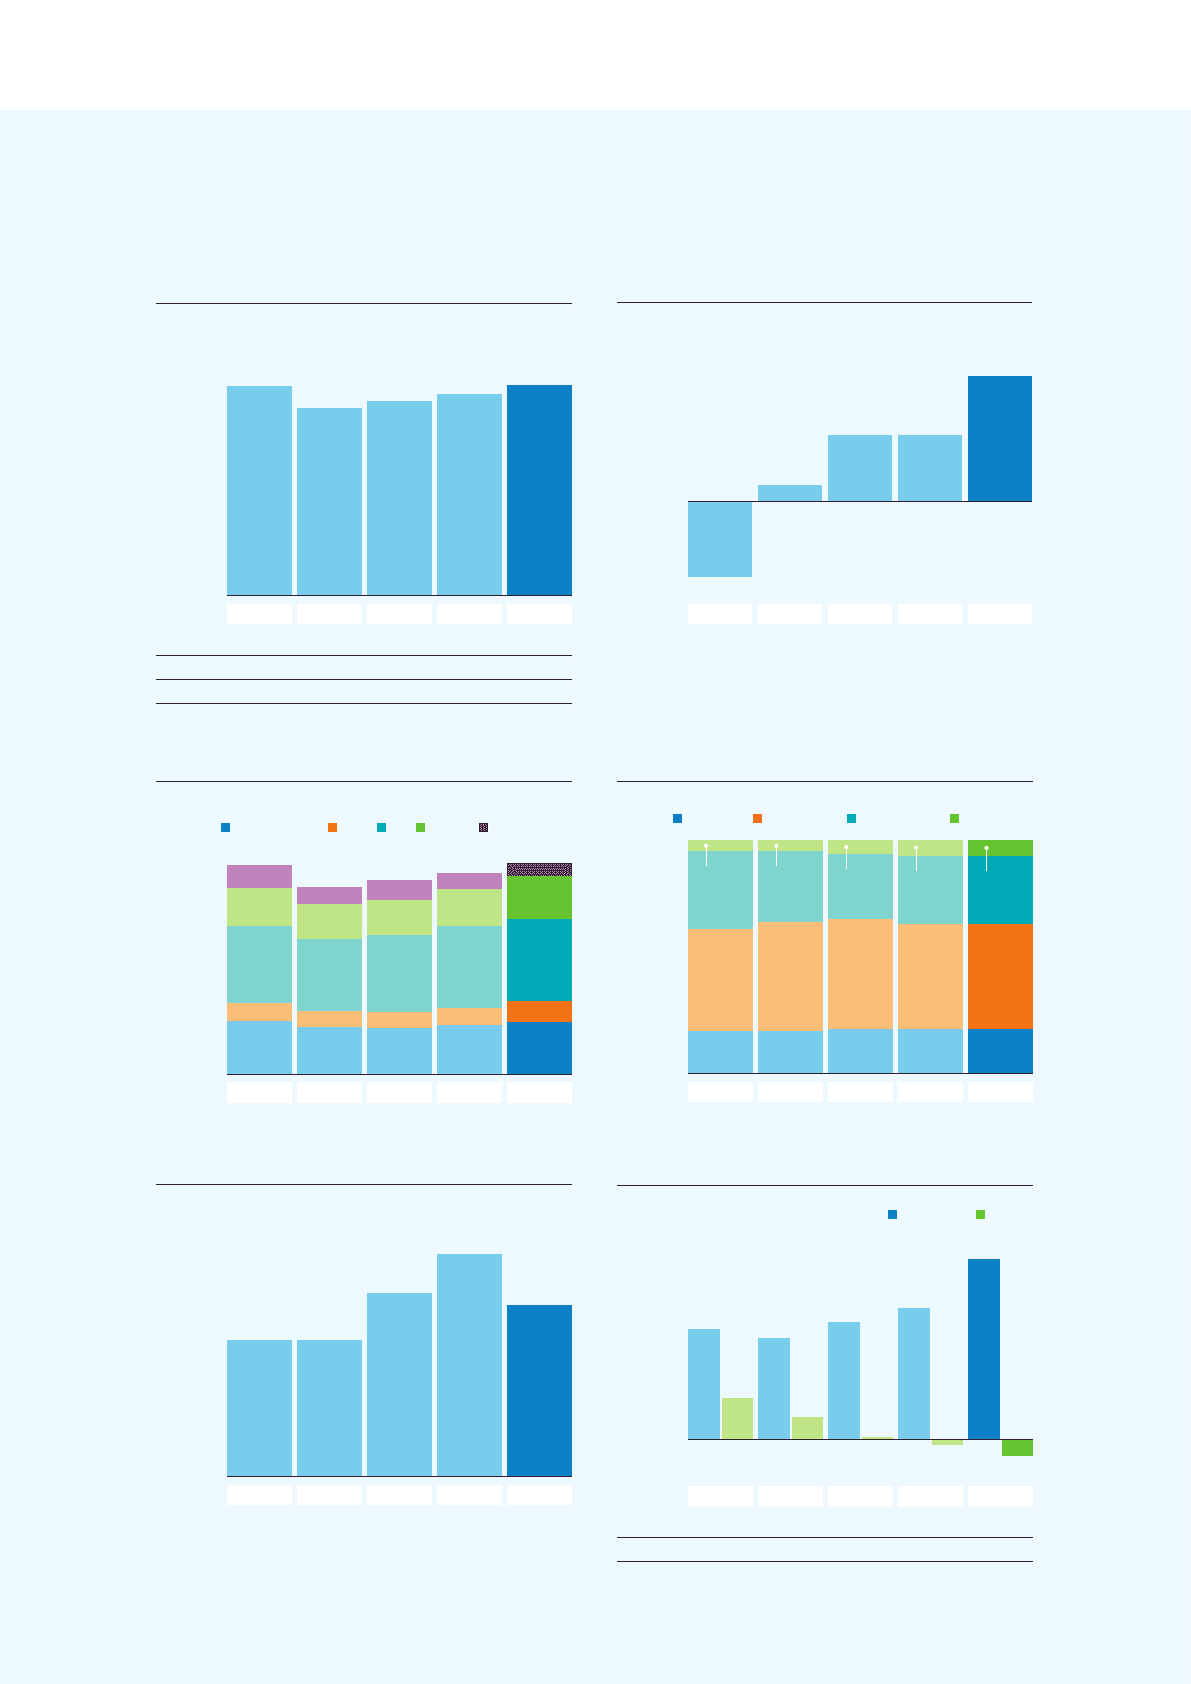
Net income (loss)
in millions of euros
6,000
4,000
2,000
0
(2,000)
(4,000) (3,206)
2002
695
2003
2,836
2004
2,868
2005
5,383
2006
Sales per region as a % of total sales
Asia Pacific Europe/Africa North America Latin America
100%
90%
80%
70%
60%
50%
40%
30%
20%
10%
0%
18 %
44 %
33 %
2002
18 %
47 %
30 %
2003
19 %
47 %
28 %
2004
19 %
45 %
29 %
2005
19 %
45 %
29 %
2006
5% 5% 6% 7% 7%
Sales
in billions of euros
30
20
10
0
26.8
2002
24.0
2003
24.9
2004
25.8
2005
27.0
2006
Sales growth
(2 %) (10 %) 3 % 4 % 5%Nominal
(1%) 3% 8% 4% 6%Comparable 2)
Sales per sector
in billions of euros
Medical Systems DAP CE Lighting Other Activities
30
25
20
15
10
5
0
6.8
2.3
9.9
4.8
3.0
2002
26.8
6.0
2.1
9.2
4.5
2.2
2003
24.0
5.9
2.0
9.9
4.5
2.6
2004
24.9
6.3
2.2
10.4
4.8
2.1
2005
25.8
6.7
2.6
10.6
5.5
1.6
2006
27.0
Earnings beforeinterest and tax as a % of sales
6%
4%
2%
0%
3.5 %
2002
3.5 %
2003
4.7 %
2004
5.7 %
2005
4.4 %
2006
Group equity and net debt2)
in billions of euros group equity net debt
25
20
15
10
5
0
(5)
14.1
5.3
2002
12.9
2.8
2003
15.0
0.2
2004
16.8
(0.8)
2005
23.1
(2.2)
2006
27 : 73 18 : 82 1 : 99 (5) : 105 (10) : 110ratio:
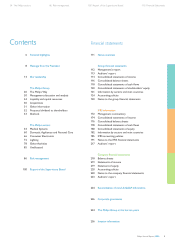
54 The Philips sectors 86 Risk management 100 Report of the Supervisory Board 110 Financial Statements