Philips 2006 Annual Report Download - page 225
Download and view the complete annual report
Please find page 225 of the 2006 Philips annual report below. You can navigate through the pages in the report by either clicking on the pages listed below, or by using the keyword search tool below to find specific information within the annual report.-
 1
1 -
2
-
3
-
4
-
5
-
6
-
7
-
8
-
9
-
10
-
11
-
12
-
13
-
14
-
15
-
16
-
17
-
18
-
19
-
20
-
21
-
22
-
23
-
24
-
25
-
26
-
27
-
28
-
29
-
30
-
31
-
32
-
33
-
34
-
35
-
36
-
37
-
38
-
39
-
40
-
41
-
42
-
43
-
44
-
45
-
46
-
47
-
48
-
49
-
50
-
51
-
52
-
53
-
54
-
55
-
56
-
57
-
58
-
59
-
60
-
61
-
62
-
63
-
64
-
65
-
66
-
67
-
68
-
69
-
70
-
71
-
72
-
73
-
74
-
75
-
76
-
77
-
78
-
79
-
80
-
81
-
82
-
83
-
84
-
85
-
86
-
87
-
88
-
89
-
90
-
91
-
92
-
93
-
94
-
95
-
96
-
97
-
98
-
99
-
100
-
101
-
102
-
103
-
104
-
105
-
106
-
107
-
108
-
109
-
110
-
111
-
112
-
113
-
114
-
115
-
116
-
117
-
118
-
119
-
120
-
121
-
122
-
123
-
124
-
125
-
126
-
127
-
128
-
129
-
130
-
131
-
132
-
133
-
134
-
135
-
136
-
137
-
138
-
139
-
140
-
141
-
142
-
143
-
144
-
145
-
146
-
147
-
148
-
149
-
150
-
151
-
152
-
153
-
154
-
155
-
156
-
157
-
158
-
159
-
160
-
161
-
162
-
163
-
164
-
165
-
166
-
167
-
168
-
169
-
170
-
171
-
172
-
173
-
174
-
175
-
176
-
177
-
178
-
179
-
180
-
181
-
182
-
183
-
184
-
185
-
186
-
187
-
188
-
189
-
190
-
191
-
192
-
193
-
194
-
195
-
196
-
197
-
198
-
199
-
200
-
201
-
202
-
203
-
204
-
205
-
206
-
207
-
208
-
209
-
210
-
211
-
212
-
213
-
214
-
 215
215 -
 216
216 -
 217
217 -
 218
218 -
 219
219 -
 220
220 -
 221
221 -
 222
222 -
 223
223 -
 224
224 -
 225
225 -
 226
226 -
 227
227 -
 228
228 -
 229
229 -
 230
230 -
 231
231 -
 232
232 -
 233
233 -
 234
234 -
 235
235 -
236
-
237
-
238
-
239
-
240
-
241
-
242
-
243
-
244
 |
 |

Philips Annual Report 2006 225
226 Corporate governance224 Reconciliation of
non-US GAAP information
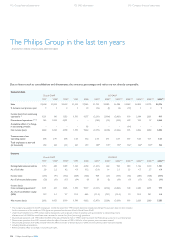
234 The Philips Group
in the last ten years
236 Investor information
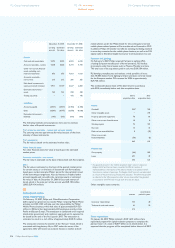
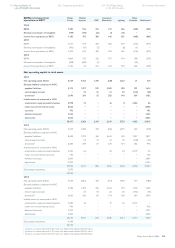
EBITA to Income from
operations or EBIT
Philips
Group
Medical
Systems DAP
Consumer
Electronics Lighting
Other
Activities Unallocated
2006
EBITA 1,382 936 412 417 666 (448 ) (601 )
Eliminate amortization of intangibles (199 ) (141 ) (26 ) (1 ) (31 ) − −
Income from operations (or EBIT) 1,183 795 386 416 635 (448 ) (601 )
2005
EBITA 1,577 770 363 506 564 (155 ) (471 )
Eliminate amortization of intangibles (105 ) (91 ) (5 ) − (8 ) (1 ) −
Income from operations (or EBIT) 1,472 679 358 506 556 (156 ) (471 )
2004
EBITA 1,864 715 336 370 594 388 (539 )
Eliminate amortization of intangibles (708 ) (680 ) (5 ) − − (23 ) −
Income from operations (or EBIT) 1,156 35 331 370 594 365 (539 )
Net operating capital to total assets
2006
Net operating capital (NOC) 8,724 4,332 1,758 (228 ) 2,527 21 314
Eliminate liabilities comprised in NOC:
payables/ liabilities - 8,175 1,707 575 2,389 989 901 1,614
intercompany accounts - − 32 25 61 50 (140 ) (28 )
provisions
1) - 2,696 241 55 285 146 807 1,162
Include assets not comprised in NOC:
investments in equity-accounted investees - 2,978 74 − 36 8 2,834 26
other non-current fi nancial assets - 8,056 − − − − − 8,056
securities - 192 − − − − − 192
deferred tax assets - 1,653 − − − − − 1,653
liquid assets - 6,023 − − − − − 6,023
38,497 6,386 2,413 2,543 3,720 4,423 19,012
2005
Net operating capital (NOC) 5,679 3,400 370 (296 ) 2,491 272 (558 )
Eliminate liabilities comprised in NOC:
payables/ liabilities - 8,498 1,712 456 2,540 956 1,017 1,817
intercompany accounts - − 34 13 64 42 (100 ) (53 )
provisions
2) - 2,385 299 57 335 134 582 978
Include assets not comprised in NOC:
investments in equity-accounted investees - 5,342 66 22 20 5,179 55
other non-current fi nancial assets - 730 − − − − − 730
deferred tax assets - 2,005 − − − − − 2,005
liquid assets - 5,293 − − − − − 5,293
29,932 5,511 896 2,665 3,643 6,950 10,267
Discontinued operations 3,973
33,905
2004
Net operating capital (NOC) 4,524 2,862 393 (161 ) 1,493 117 (180 )
Eliminate liabilities comprised in NOC:
payables/ liabilities - 7,186 1,492 353 2,162 710 1,120 1,349
intercompany accounts - − 35 10 62 26 (115 ) (18 )
provisions
3) - 2,445 240 60 314 138 619 1,074
Include assets not comprised in NOC:
investments in equity-accounted investees - 5,284 46 − 19 46 5,173 −
other non-current fi nancial assets - 956 − − − − − 956
deferred tax assets - 1,797 − − − − − 1,797
liquid assets - 4,349 − − − − − 4,349
26,541 4,675 816 2,396 2,413 6,914 9,327
Discontinued operations 4,198
30,739
1) provisions on balance sheet EUR 3,325 million excl. deferred tax liabilities EUR 629 million
2) provisions on balance sheet EUR 2,710 million excl. deferred tax liabilities EUR 325 million
3) provisions on balance sheet EUR 2,673 million excl. deferred tax liabilities EUR 228 million