Philips 2006 Annual Report Download - page 199
Download and view the complete annual report
Please find page 199 of the 2006 Philips annual report below. You can navigate through the pages in the report by either clicking on the pages listed below, or by using the keyword search tool below to find specific information within the annual report.-
 1
1 -
2
-
3
-
4
-
5
-
6
-
7
-
8
-
9
-
10
-
11
-
12
-
13
-
14
-
15
-
16
-
17
-
18
-
19
-
20
-
21
-
22
-
23
-
24
-
25
-
26
-
27
-
28
-
29
-
30
-
31
-
32
-
33
-
34
-
35
-
36
-
37
-
38
-
39
-
40
-
41
-
42
-
43
-
44
-
45
-
46
-
47
-
48
-
49
-
50
-
51
-
52
-
53
-
54
-
55
-
56
-
57
-
58
-
59
-
60
-
61
-
62
-
63
-
64
-
65
-
66
-
67
-
68
-
69
-
70
-
71
-
72
-
73
-
74
-
75
-
76
-
77
-
78
-
79
-
80
-
81
-
82
-
83
-
84
-
85
-
86
-
87
-
88
-
89
-
90
-
91
-
92
-
93
-
94
-
95
-
96
-
97
-
98
-
99
-
100
-
101
-
102
-
103
-
104
-
105
-
106
-
107
-
108
-
109
-
110
-
111
-
112
-
113
-
114
-
115
-
116
-
117
-
118
-
119
-
120
-
121
-
122
-
123
-
124
-
125
-
126
-
127
-
128
-
129
-
130
-
131
-
132
-
133
-
134
-
135
-
136
-
137
-
138
-
139
-
140
-
141
-
142
-
143
-
144
-
145
-
146
-
147
-
148
-
149
-
150
-
151
-
152
-
153
-
154
-
155
-
156
-
157
-
158
-
159
-
160
-
161
-
162
-
163
-
164
-
165
-
166
-
167
-
168
-
169
-
170
-
171
-
172
-
173
-
174
-
175
-
176
-
177
-
178
-
179
-
180
-
181
-
182
-
183
-
184
-
185
-
186
-
187
-
188
-
 189
189 -
 190
190 -
 191
191 -
 192
192 -
 193
193 -
 194
194 -
 195
195 -
 196
196 -
 197
197 -
 198
198 -
 199
199 -
 200
200 -
 201
201 -
 202
202 -
 203
203 -
 204
204 -
 205
205 -
 206
206 -
 207
207 -
 208
208 -
 209
209 -
210
-
211
-
212
-
213
-
214
-
215
-
216
-
217
-
218
-
219
-
220
-
221
-
222
-
223
-
224
-
225
-
226
-
227
-
228
-
229
-
230
-
231
-
232
-
233
-
234
-
235
-
236
-
237
-
238
-
239
-
240
-
241
-
242
-
243
-
244
 |
 |

Philips Annual Report 2006 199
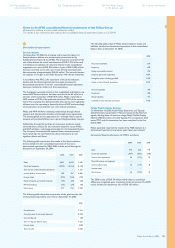
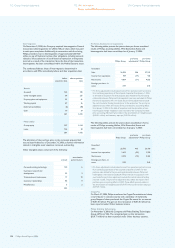
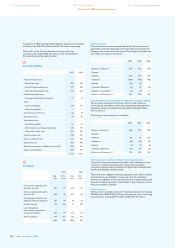
41
Financial income and expenses
2004 2005 2006
Interest income 48 92 156
Interest expense (306 ) (289 ) (339 )
Net interest expense (258 ) (197 ) (183 )
Reversal of prior-year impairments
on available-for-sale securities 19 − −
Income from non-current
fi nancial assets 240 242 334
Foreign exchange results (1 ) 1 2
Miscellaneous fi nancing
costs/income, net 34 67 (118 )
Total other fi nancial income
and expense 292 310 218
34 113 35
Interest income increased by EUR 64 million during 2006, this was
mainly as a result of higher average cash balances and higher average
interest rates applied to these cash balances during 2006 compared
to 2005.
Interest expense increased by EUR 50 million during 2006, mainly
as a result of higher interest costs related to hedging of the Group’s
foreign currency denominated cash balances and inter-company
funding positions.
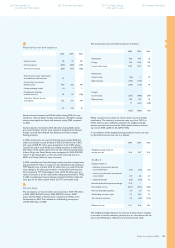
In 2006, income from non-current fi nancial assets totaled EUR 334
million and included a cash dividend of EUR 223 million from TSMC
and a gain of EUR 97 million upon designation of the TSMC shares
received through a stock dividend as trading securities. In 2005, EUR
235 million of tax-exempt gains from the sale of the remaining shares
in Atos Origin and Great Nordic were recognized. In 2004, EUR 238
million of tax-exempt gains on the sale of the remaining shares in
ASML and Vivendi Universal were recorded.
In 2006, miscellaneous fi nancial charges mainly included an impairment
charge of EUR 77 million in relation to the available-for-sale holding in
TPO Display Corp, a further EUR 61 million loss as a result of the fair
value change in the share option within a convertible bond issued to
the Company by TPV Technology Ltd and a EUR 29 million gain as a
result of increases in the fair value of the trading securities held in TSMC.
In 2005 miscellaneous fi nancial charges included a EUR 53 million fair
value gain on the share option within the TPV convertible bond.
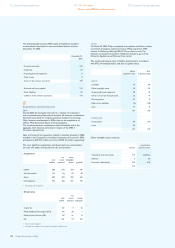
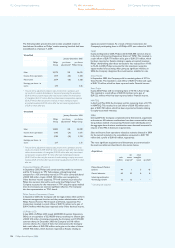
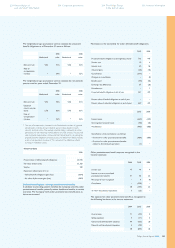
42
Income taxes
The tax expense on income before tax amounted to EUR 159 million
in 2006 (2005: EUR 481 million, 2004: EUR 183 million). TSMC
shares held by Philips in Taiwan were transferred to Philips in the
Netherlands in 2005. This resulted in a withholding tax expense
of EUR 240 million in 2005.
4141
4242
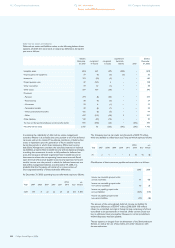
The components of income before taxes are as follows:
2004 2005 2006
Netherlands 565 427 32
Foreign 574 1,105 942
Income before taxes 1,139 1,532 974
Netherlands:
Current taxes (46 ) 3 81
Deferred taxes (154 ) (123 ) −
(200 ) (120 ) 81
Foreign:
Current taxes (253 ) (488 ) (273 )
Deferred taxes 270 127 33
17 (361 ) (240 )
(183 ) (481 ) (159 )
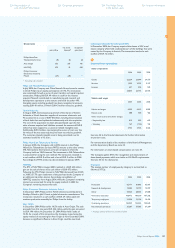
Philips’ operations are subject to income taxes in various foreign
jurisdictions. The statutory income tax rates vary from 12.5% to
41.0%, which causes a difference between the weighted average
statutory income tax rate and the Netherlands’ statutory income
tax rate of 29.6%. (2005: 31.5%, 2004: 34.5%).
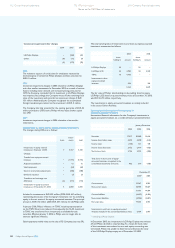
A reconciliation of the weighted average statutory income tax rate
to the effective income tax rate is as follows:
2004 2005 2006
Weighted average statutory
income tax rate 34.6 32.7 31.6
Tax effect of:
Changes related to:
utilization of previously reserved
loss carryforwards
-
(1.6 ) (3.2 ) (2.1 )
new loss carryforwards not expected
to be realized
-
3.4 3.2 2.7
addition/(releases) - (5.6 ) (9.6 ) 4.3
Non-tax-deductible impairment charges 17.8 − −
Non-taxable income (40.1 ) (10.3 ) (20.3 )
Non-tax-deductible expenses 3.0 5.0 11.2
Withholding and other taxes 1.2 16.8 1.5
Tax incentives and other 3.4 (3.2 ) (12.6 )
Effective tax rate 16.1 31.4 16.3
The weighted average statutory tax rate was declined due to changes
in tax rates in certain countries, primarily due to a decrease in the tax
rate in the Netherlands, refl ected in Tax incentives and other.
226 Corporate governance224 Reconciliation of
non-US GAAP information
234 The Philips Group
in the last ten years
236 Investor information