Philips 2006 Annual Report Download - page 166
Download and view the complete annual report
Please find page 166 of the 2006 Philips annual report below. You can navigate through the pages in the report by either clicking on the pages listed below, or by using the keyword search tool below to find specific information within the annual report.-
 1
1 -
2
-
3
-
4
-
5
-
6
-
7
-
8
-
9
-
10
-
11
-
12
-
13
-
14
-
15
-
16
-
17
-
18
-
19
-
20
-
21
-
22
-
23
-
24
-
25
-
26
-
27
-
28
-
29
-
30
-
31
-
32
-
33
-
34
-
35
-
36
-
37
-
38
-
39
-
40
-
41
-
42
-
43
-
44
-
45
-
46
-
47
-
48
-
49
-
50
-
51
-
52
-
53
-
54
-
55
-
56
-
57
-
58
-
59
-
60
-
61
-
62
-
63
-
64
-
65
-
66
-
67
-
68
-
69
-
70
-
71
-
72
-
73
-
74
-
75
-
76
-
77
-
78
-
79
-
80
-
81
-
82
-
83
-
84
-
85
-
86
-
87
-
88
-
89
-
90
-
91
-
92
-
93
-
94
-
95
-
96
-
97
-
98
-
99
-
100
-
101
-
102
-
103
-
104
-
105
-
106
-
107
-
108
-
109
-
110
-
111
-
112
-
113
-
114
-
115
-
116
-
117
-
118
-
119
-
120
-
121
-
122
-
123
-
124
-
125
-
126
-
127
-
128
-
129
-
130
-
131
-
132
-
133
-
134
-
135
-
136
-
137
-
138
-
139
-
140
-
141
-
142
-
143
-
144
-
145
-
146
-
147
-
148
-
149
-
150
-
151
-
152
-
153
-
154
-
155
-
 156
156 -
 157
157 -
 158
158 -
 159
159 -
 160
160 -
 161
161 -
 162
162 -
 163
163 -
 164
164 -
 165
165 -
 166
166 -
 167
167 -
 168
168 -
 169
169 -
 170
170 -
 171
171 -
 172
172 -
 173
173 -
 174
174 -
 175
175 -
 176
176 -
177
-
178
-
179
-
180
-
181
-
182
-
183
-
184
-
185
-
186
-
187
-
188
-
189
-
190
-
191
-
192
-
193
-
194
-
195
-
196
-
197
-
198
-
199
-
200
-
201
-
202
-
203
-
204
-
205
-
206
-
207
-
208
-
209
-
210
-
211
-
212
-
213
-
214
-
215
-
216
-
217
-
218
-
219
-
220
-
221
-
222
-
223
-
224
-
225
-
226
-
227
-
228
-
229
-
230
-
231
-
232
-
233
-
234
-
235
-
236
-
237
-
238
-
239
-
240
-
241
-
242
-
243
-
244
 |
 |

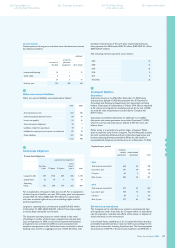
Philips Annual Report 2006166
34
Information on remuneration of the individual members of
the Board of Management
and the Supervisory Board
Remuneration of the Board of Management
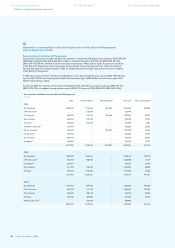
Remuneration and pension charges relating to the members of the Board of Management amounted to EUR 9,090,403
(2005: EUR 6,363,218; 2004: EUR 6,364,709). In 2006, an additional amount of EUR 645,123 (2005: EUR 431,001,
2004: EUR 492,740) was awarded in the form of other compensation. When pension rights are granted to members
of the Board of Management, necessary payments (if insured) and all necessary provisions are made in accordance
with the applicable accounting principles. In 2006, no (additional) pension benefi ts were granted to former members
of the Board of Management.
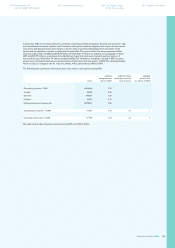
In 2006, the present members of the Board of Management were granted 198,027 stock options (2005: 144,018 stock
options; 2004: 152,019 stock options) and 66,009 restricted share rights (2005: 48,006 restricted share rights; 2004:
50,673 restricted share rights).
At year-end 2006, the members of the Board of Management held 1,355,765 stock options (year-end 2005: 923,551;
2004: 1,099,539) at a weighted average exercise price of EUR 27.70 (year-end 2005: EUR 28.33; 2004: EUR 30.44).
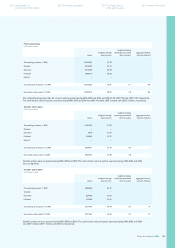
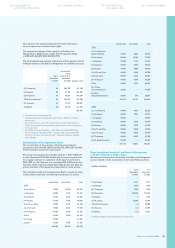
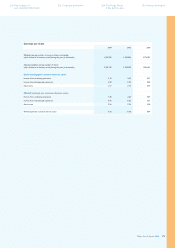
Remuneration individual members Board of Management
in euros
salary annual incentive
1) special payment
2) total cash other compensation
3)
2006
G.J. Kleisterlee 1,042,500 1,150,560 350,000 2,543,060 300,064
J.H.M. Hommen
4) − 323,018 − 323,018 −
P-J. Sivignon
5) 568,750 219,191 300,000 1,087,941 60,671
G.H.A. Dutiné 540,750 433,998 − 974,748 99,373
A. Huijser
6) 150,000 507,600 − 657,600 6,835
T.W.H.P. van Deursen
7) 412,500 − − 412,500 28,265
F.A. van Houten
8) 262,500 − 400,000 1,174,375
9) 21,602
J.A. Karvinen
10) 400,000 − − 400,000 79,710
R.S. Provoost
11) 393,750 − − 393,750 34,632
A. Ragnetti
12) 356,250 − − 356,250 13,971
4,127,000 2,634,367 1,050,000 8,323,242 645,123
2005
G.J. Kleisterlee 1,020,000 1,028,160 − 2,048,160 278,716
J.H.M. Hommen
13) 381,818 846,720 − 1,228,538 47,019
P-J. Sivignon
14) 259,091 − − 259,091 14,318
G.H.A. Dutiné 511,000 509,040 − 1,020,040 68,895
A. Huijser 587,500 554,400 − 1,141,900 22,053
2,759,409 2,938,320 − 5,697,729 431,001
2004
G.J. Kleisterlee 1,015,000 867,600 − 1,882,600 274,538
J.H.M. Hommen 835,000 711,432 − 1,546,432 109,272
G.H.A. Dutiné 505,000 438,138 − 943,138 58,750
A. Huijser 537,500 433,800 − 971,300 50,180
A.P.M. van der Poel
15) − 186,482 − 186,482 −
2,892,500 2,637,452 − 5,529,952 492,740
112 Group fi nancial statements
Notes to the group fi nancial statements
172 IFRS information 218 Company fi nancial statements